Capital One 2007 Annual Report Download - page 75
Download and view the complete annual report
Please find page 75 of the 2007 Capital One annual report below. You can navigate through the pages in the report by either clicking on the pages listed below, or by using the keyword search tool below to find specific information within the annual report.-
 1
1 -
2
-
3
-
4
-
5
-
6
-
7
-
8
-
9
-
10
-
11
-
12
-
13
-
14
-
15
-
16
-
17
-
18
-
19
-
20
-
21
-
22
-
23
-
24
-
25
-
26
-
27
-
28
-
29
-
30
-
31
-
32
-
33
-
34
-
35
-
36
-
37
-
38
-
39
-
40
-
41
-
42
-
43
-
44
-
45
-
46
-
47
-
48
-
49
-
50
-
51
-
52
-
53
-
54
-
55
-
56
-
57
-
58
-
59
-
60
-
61
-
62
-
63
-
64
-
 65
65 -
 66
66 -
 67
67 -
 68
68 -
 69
69 -
 70
70 -
 71
71 -
 72
72 -
 73
73 -
 74
74 -
 75
75 -
 76
76 -
 77
77 -
 78
78 -
 79
79 -
 80
80 -
 81
81 -
 82
82 -
 83
83 -
 84
84 -
 85
85 -
86
-
87
-
88
-
89
-
90
-
91
-
92
-
93
-
94
-
95
-
96
-
97
-
98
-
99
-
100
-
101
-
102
-
103
-
104
-
105
-
106
-
107
-
108
-
109
-
110
-
111
-
112
-
113
-
114
-
115
-
116
-
117
-
118
-
119
-
120
-
121
-
122
-
123
-
124
-
125
-
126
-
127
-
128
-
129
-
130
-
131
-
132
-
133
-
134
-
135
-
136
-
137
-
138
-
139
-
140
-
141
-
142
-
143
-
144
-
145
-
146
-
147
 |
 |

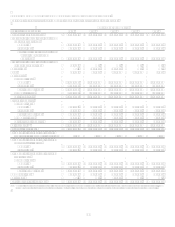
53
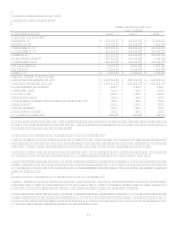
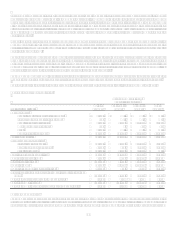
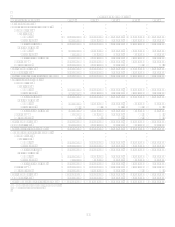
TABLE BINTEREST VARIANCE ANALYSIS
Year Ended December 31
2007 vs. 2006 2006 vs. 2005
(Dollars in thousands) Increase
(Decrease) Volume
Yield/
Rate
Increase
(Decrease) Volume
Yield/
Rate
Interest Income:
Consumer loans
Domestic $ 614,854 $ 1,090,917 $ (476,063) $ 1,759,916 $ 1,969,744 $ (209,828)
International 3,242 (43,978) 47,220
(19,526) (27,114) 7,588
Total 618,096 1,046,777 (428,681) 1,740,390 1,921,082 (180,692)
Commercial loans 1,835,559 1,459,954 375,605
295,244 404,940 (109,696)
Total loans held for investment 2,453,655 3,085,095 (631,440) 2,035,634 2,573,519 (537,885)
Securities available for sale(2) 274,260 209,136 65,124
289,816 201,138 88,678
Other
Domestic(2) 181,807 230,549 (48,742) 141,390 114,750 26,640
International 3,699 2,122 1,577
(28,986) (15,214) (13,772)
Total 185,506 221,064 (35,558) 112,404 82,035 30,369
Total interest income 2,913,421 3,432,439 (519,018) 2,437,854 2,789,672 (351,818)
Interest Expense:
Deposits
Domestic 1,080,676 1,096,830 (16,154) 657,775 689,359 (31,584)
International 10,878 (580) 11,458
(16,115) (10,062) (6,053)
Total 1,091,554 1,109,651 (18,097) 641,660 690,927 (49,267)
Senior notes 165,485 177,401 (11,916) (9,575) (12) (9,563)
Other borrowings
Domestic 213,879 139,512 74,367
384,942 244,015 140,927
International 4,104 (241) 4,345
9,623 10,351 (728)
Total 217,983 131,287 86,696
394,565 290,449 104,116
Total interest expense 1,475,022 1,481,092 (6,070) 1,026,650 1,037,357 (10,707)
Net interest income $ 1,438,399 $ 2,058,620 $ (620,221) $ 1,411,204 $ 1,752,135 $ (340,931)
(1) The change in interest due to both volume and rates has been allocated in proportion to the relationship of the absolute dollar amounts of the change in each. The changes in
income and expense are calculated independently for each line in the table. The totals for the volume and yield/rate columns are not the sum of the individual lines.
(2) Prior period amounts have been reclassified to conform with current period presentation.
(3) Based on continuing operations.