Capital One 2007 Annual Report Download - page 125
Download and view the complete annual report
Please find page 125 of the 2007 Capital One annual report below. You can navigate through the pages in the report by either clicking on the pages listed below, or by using the keyword search tool below to find specific information within the annual report.-
 1
1 -
2
-
3
-
4
-
5
-
6
-
7
-
8
-
9
-
10
-
11
-
12
-
13
-
14
-
15
-
16
-
17
-
18
-
19
-
20
-
21
-
22
-
23
-
24
-
25
-
26
-
27
-
28
-
29
-
30
-
31
-
32
-
33
-
34
-
35
-
36
-
37
-
38
-
39
-
40
-
41
-
42
-
43
-
44
-
45
-
46
-
47
-
48
-
49
-
50
-
51
-
52
-
53
-
54
-
55
-
56
-
57
-
58
-
59
-
60
-
61
-
62
-
63
-
64
-
65
-
66
-
67
-
68
-
69
-
70
-
71
-
72
-
73
-
74
-
75
-
76
-
77
-
78
-
79
-
80
-
81
-
82
-
83
-
84
-
85
-
86
-
87
-
88
-
89
-
90
-
91
-
92
-
93
-
94
-
95
-
96
-
97
-
98
-
99
-
100
-
101
-
102
-
103
-
104
-
105
-
106
-
107
-
108
-
109
-
110
-
111
-
112
-
113
-
114
-
 115
115 -
 116
116 -
 117
117 -
 118
118 -
 119
119 -
 120
120 -
 121
121 -
 122
122 -
 123
123 -
 124
124 -
 125
125 -
 126
126 -
 127
127 -
 128
128 -
 129
129 -
 130
130 -
 131
131 -
 132
132 -
 133
133 -
 134
134 -
 135
135 -
136
-
137
-
138
-
139
-
140
-
141
-
142
-
143
-
144
-
145
-
146
-
147
 |
 |

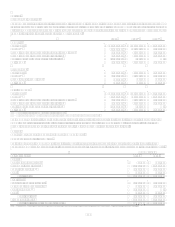
103
principal repayment rates, lives of receivables and discount rates included in the following table. The charge-off rates are determined
using forecasted net charge-offs expected for the trust calculated consistently with other company charge-off forecasts. The principal
repayment rate assumptions are determined using actual and forecasted trust principal repayment rates based on the collateral. The
lives of receivables are determined as the number of months necessary to pay off the investors given the principal repayment rate
assumptions. The discount rates are determined using primarily trust specific statistics and forward rate curves, and are reflective of
what market participants would use in a similar valuation. Additionally cash reserve and spread accounts are discounted over the
estimated life of the assets.
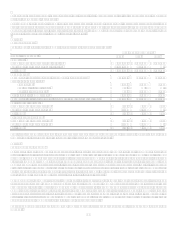
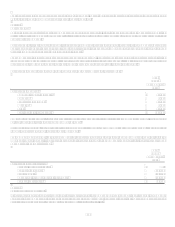
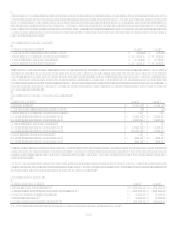
Securitization Key Assumptions
Year Ended December 31 2007 2006
Weighted average life for receivables (months) 8 to 9 8 to 9
Principal repayment rate (weighted average rate) 15% to 17% 14% to 16%
Charge-off rate (weighted average rate) 4% to 5% 3% to 4%
Discount rate (weighted average rate) 11% to 13% 10% to 13%
If these assumptions are not met, or if they change, the interest-only strip and related servicing and securitizations income would be
affected. The following adverse changes to the key assumptions and estimates, presented in accordance with SFAS 140, are
hypothetical and should be used with caution. As the figures indicate, any change in fair value based on a 10% or 20% variation in
assumptions cannot be extrapolated because the relationship of a change in assumption to the change in fair value may not be linear.
Also, the effect of a variation in a particular assumption on the fair value of the interest-only strip is calculated independently from
any change in another assumption. However, changes in one factor may result in changes in other factors, which might magnify or
counteract the sensitivities.
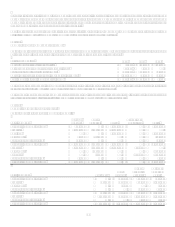
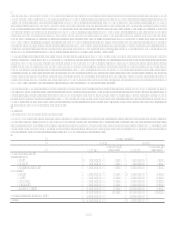
Securitization Key Assumptions and Sensitivities
As of December 31 2007 2006
Interest-only strip $ 429,288 $ 448,684
Weighted average life for receivables (months) 8 8
Principal repayment rate (weighted average rate) 15% 16%
Impact on fair value of 10% adverse change $ (28,032) $ (26,505)
Impact on fair value of 20% adverse change (53,231) (49,799)
Charge-off rate (weighted average rate) 5% 4%
Impact on fair value of 10% adverse change $ (74,193) $ (45,334)
Impact on fair value of 20% adverse change (133,681) (90,476)
Discount rate (weighted average rate) 13% 10%
Impact on fair value of 10% adverse change $ (2,097) $ (2,042)
Impact on fair value of 20% adverse change (4,170) (4,109)
Static pool credit losses are calculated by summing the actual and projected future credit losses and dividing them by the original
balance of each pool of assets. Due to the short-term revolving nature of the loan receivables, the weighted average percentage of
static pool credit losses is not considered materially different from the assumed charge-off rates used to determine the fair value of the
retained interests.
The Company acts as a servicing agent and receives contractual servicing fees of between 0.50% and 4% of the investor principal
outstanding, based upon the type of assets serviced. The Company generally does not record material servicing assets or liabilities for
these rights since the contractual servicing fee approximates market rates.
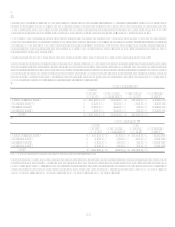
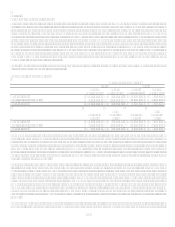
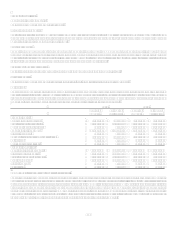
Securitization Cash Flows
Year Ended December 31 2007 2006
Proceeds from new securitizations $ 12,641,050 $ 12,343,771
Collections reinvested in revolving-period securitizations 92,917,318
85,525,697
Repurchases of accounts from the trust 344,287
236,964
Servicing fees received 969,552
893,046
Cash flows received on retained interests(1) 5,290,100
4,465,769
(1) Includes all cash receipts of excess spread and other payments (excluding servicing fees) from the trust to the Company.