Capital One 2007 Annual Report Download - page 63
Download and view the complete annual report
Please find page 63 of the 2007 Capital One annual report below. You can navigate through the pages in the report by either clicking on the pages listed below, or by using the keyword search tool below to find specific information within the annual report.-
 1
1 -
2
-
3
-
4
-
5
-
6
-
7
-
8
-
9
-
10
-
11
-
12
-
13
-
14
-
15
-
16
-
17
-
18
-
19
-
20
-
21
-
22
-
23
-
24
-
25
-
26
-
27
-
28
-
29
-
30
-
31
-
32
-
33
-
34
-
35
-
36
-
37
-
38
-
39
-
40
-
41
-
42
-
43
-
44
-
45
-
46
-
47
-
48
-
49
-
50
-
51
-
52
-
 53
53 -
 54
54 -
 55
55 -
 56
56 -
 57
57 -
 58
58 -
 59
59 -
 60
60 -
 61
61 -
 62
62 -
 63
63 -
 64
64 -
 65
65 -
 66
66 -
 67
67 -
 68
68 -
 69
69 -
 70
70 -
 71
71 -
 72
72 -
 73
73 -
74
-
75
-
76
-
77
-
78
-
79
-
80
-
81
-
82
-
83
-
84
-
85
-
86
-
87
-
88
-
89
-
90
-
91
-
92
-
93
-
94
-
95
-
96
-
97
-
98
-
99
-
100
-
101
-
102
-
103
-
104
-
105
-
106
-
107
-
108
-
109
-
110
-
111
-
112
-
113
-
114
-
115
-
116
-
117
-
118
-
119
-
120
-
121
-
122
-
123
-
124
-
125
-
126
-
127
-
128
-
129
-
130
-
131
-
132
-
133
-
134
-
135
-
136
-
137
-
138
-
139
-
140
-
141
-
142
-
143
-
144
-
145
-
146
-
147
 |
 |

41
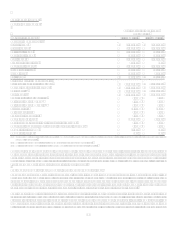
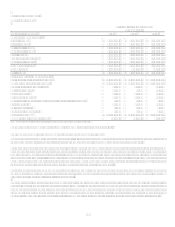
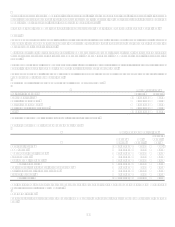
U.S. Card Sub-Segment
Table 4: U.S. Card
As of and for the Year Ended
December 31,
(Dollars in thousands) 2007 2006 2005
Earnings (Managed Basis)
Interest income $ 7,606,403 $ 6,872,507 $ 6,614,854
Interest expense 2,364,222 2,156,709 1,820,898
Net interest income 5,242,181 4,715,798 4,793,956
Non-interest income 3,643,359 3,255,681 3,321,457
Total revenue 8,885,540 7,971,479 8,115,413
Provision for loan losses 2,351,966 1,644,619 2,279,109
Non-interest expense 3,307,576 3,521,627 3,356,600
Income before taxes 3,225,998 2,805,233 2,479,704
Income taxes 1,109,743 981,833 870,351
Net income $ 2,116,255 $ 1,823,400 $ 1,609,353
Selected Metrics (Managed Basis)
Period end loans held for investment $ 52,078,847 $ 53,623,680 $ 49,463,522
Average loans held for investment $ 50,346,600 $ 49,484,223 $ 46,827,775
Loans held for investment yield 15.11% 13.89% 14.13%
Net interest margin 10.41% 9.53% 10.24%
Revenue margin 17.65% 16.11% 17.33%
Risk adjusted margin 13.33% 12.74% 12.33%
Non-interest expense as a % of average loans held for investment 6.57% 7.12% 7.17%
Efficiency ratio 37.22% 44.18% 41.36%
Net charge-off rate 4.31% 3.37% 5.01%
30+ day delinquency rate 4.95% 3.74% 3.44%
Purchase Volume(1) $ 85,559,652 $ 83,126,876 $ 73,687,136
Number of Total Accounts (000s) 36,450 37,630 37,645
(1) Includes purchase transactions net of returns and excludes cash advance transactions.
The U.S. Card sub-segment consists of domestic consumer credit card lending activities.
Year Ended December 31, 2007 Compared to Year Ended December 31, 2006
The U.S. Card sub-segment had earnings of $2.1 billion, an increase of 16% year over year due to higher revenue generation and
increased operational efficiency, partially offset by the worsening credit environment and associated reserve build.
Period end loans outstanding decreased $1.5 billion, or 3%, during 2007 mainly driven by a portfolio sale related to the exit of a co-
branded credit card partnership at the end of the first quarter of 2007 and our prime revolver marketing pull-back. We are also
experiencing a modest increase in asset attrition as compared to 2006, resulting from repricing parts of the portfolio where original
terms had expired. Asset attrition remains at lower levels than those experienced in 2005 and earlier periods. Managed purchase
volume increased by 3% over the prior year. Purchase volume growth was muted by a deceleration in retail sales growth, the sale of
the co-branded credit card partnership and the impact of other deliberate strategy choices.
Total revenues increased by 11% over prior year, as our margins expanded due to product and marketing strategy changes
implemented in 2007. Primary drivers of the increase in revenue margin include selective pricing and fee changes, pull-back from
prime revolver space as well as other strategy changes.
The provision for loan losses increased 43% to $2.4 billion during 2007. The increase is partly driven by normalization of credit in
2007 following the unusually favorable credit environment in 2006 and by economic weakening consistent with recently released
economic indicators. The increased charge-off rate in 2007 was exacerbated by the pull back from the prime revolver space
throughout the year, and by the pricing and fee moves in the second and third quarters. Non-interest expenses for 2007 decreased by
6%, due to lower marketing spend as a result of the Companys evolving marketing strategy and increased operational efficiency.