Capital One 2007 Annual Report Download - page 79
Download and view the complete annual report
Please find page 79 of the 2007 Capital One annual report below. You can navigate through the pages in the report by either clicking on the pages listed below, or by using the keyword search tool below to find specific information within the annual report.-
 1
1 -
2
-
3
-
4
-
5
-
6
-
7
-
8
-
9
-
10
-
11
-
12
-
13
-
14
-
15
-
16
-
17
-
18
-
19
-
20
-
21
-
22
-
23
-
24
-
25
-
26
-
27
-
28
-
29
-
30
-
31
-
32
-
33
-
34
-
35
-
36
-
37
-
38
-
39
-
40
-
41
-
42
-
43
-
44
-
45
-
46
-
47
-
48
-
49
-
50
-
51
-
52
-
53
-
54
-
55
-
56
-
57
-
58
-
59
-
60
-
61
-
62
-
63
-
64
-
65
-
66
-
67
-
68
-
 69
69 -
 70
70 -
 71
71 -
 72
72 -
 73
73 -
 74
74 -
 75
75 -
 76
76 -
 77
77 -
 78
78 -
 79
79 -
 80
80 -
 81
81 -
 82
82 -
 83
83 -
 84
84 -
 85
85 -
 86
86 -
 87
87 -
 88
88 -
 89
89 -
90
-
91
-
92
-
93
-
94
-
95
-
96
-
97
-
98
-
99
-
100
-
101
-
102
-
103
-
104
-
105
-
106
-
107
-
108
-
109
-
110
-
111
-
112
-
113
-
114
-
115
-
116
-
117
-
118
-
119
-
120
-
121
-
122
-
123
-
124
-
125
-
126
-
127
-
128
-
129
-
130
-
131
-
132
-
133
-
134
-
135
-
136
-
137
-
138
-
139
-
140
-
141
-
142
-
143
-
144
-
145
-
146
-
147
 |
 |
57
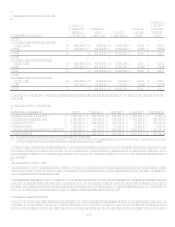
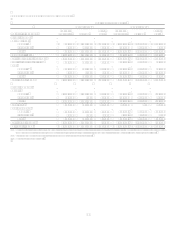
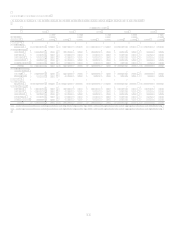
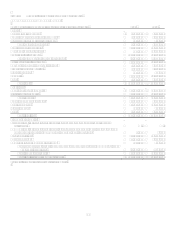
TABLE EDELINQUENCIES
Table E shows the Companys loan delinquency trends for the periods presented on a reported and managed basis.
As of December 31
2007 2006 2005 2004 2003
(Dollars in
thousands) Loans
% of
Total
Loans Loans
% of
Total
Loans Loans
% of
Total
Loans Loans
% of
Total
Loans Loans
% of
Total
Loans
Reported(1):
Loans held for
investment $ 101,805,027 100.00% $ 96,512,139 100.00% $ 59,847,681 100.00% $ 38,215,591 100.00% $ 32,850,269 100.00 %
Loans delinquent:
30-59 days 2,052,086 2.02% 1,512,365 1.57% 1,055,027 1.76% 741,723 1.94% 755,930 2.30 %
60-89 days 869,452 0.86% 563,012 0.58% 401,640 0.67% 313,559 0.82% 362,766 1.10 %
90-119 days 450,268 0.44% 291,759 0.30% 230,780 0.39% 196,457 0.51% 207,353 0.63 %
120-149 days 194,892 0.19% 167,260 0.17% 104,817 0.18% 120,589 0.32% 149,246 0.45 %
150 or more days 154,746 0.15% 114,007 0.12% 86,744 0.14% 99,866 0.26% 98,164 0.31 %
Total $ 3,721,444 3.66% $ 2,648,403 2.74% $ 1,879,008 3.14% $ 1,472,194 3.85% $ 1,573,459 4.79 %
Loans delinquent by
geographic area:
Domestic 3,592,845 3.67% 2,543,050 2.74% 1,789,926 3.20% 1,380,022 4.05% 1,509,370 5.06 %
International 128,599 3.20% 105,353 2.74% 89,082 2.28% 92,172 2.04% 64,089 2.13 %
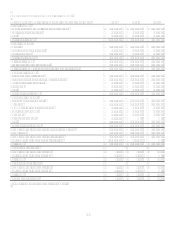
Managed(2):
Loans held for
investment $ 151,362,417 100.00% $ 146,151,268 100.00% $ 105,527,491 100.00% $ 79,861,299 100.00% $ 71,244,796 100.00 %
Loans delinquent:
30-59 days 2,737,547 1.81% 2,129,884 1.46% 1,620,075 1.54% 1,299,782 1.63% 1,335,231 1.87 %
60-89 days 1,343,539 0.89% 945,844 0.65% 740,917 0.70% 664,629 0.83% 718,247 1.01 %
90-119 days 840,776 0.55% 602,472 0.41% 498,927 0.47% 479,404 0.60% 488,471 0.69 %
120-149 days 512,789 0.34% 412,386 0.28% 309,587 0.29% 336,924 0.42% 365,971 0.51 %
150 or more days 429,146 0.28% 323,459 0.22% 254,314 0.24% 273,339 0.34% 270,009 0.38 %
Total $ 5,863,797 3.87% $ 4,414,045 3.02% $ 3,423,820 3.24% $ 3,054,078 3.82% $ 3,177,929 4.46 %
(1) Includes non-accrual consumer auto loans of $593.6 million in 2007, $336.6 million in 2006, $240.1 million in 2005, $141.6 million in 2004 and $218.8 million in 2003.
(2) Includes non-accrual consumer auto loans of $597.7 million in 2007, $350.6 million in 2006, $258.7 million in 2005, $141.6 million in 2004 and $218.8 million in 2003.