Capital One 2007 Annual Report Download - page 58
Download and view the complete annual report
Please find page 58 of the 2007 Capital One annual report below. You can navigate through the pages in the report by either clicking on the pages listed below, or by using the keyword search tool below to find specific information within the annual report.-
 1
1 -
2
-
3
-
4
-
5
-
6
-
7
-
8
-
9
-
10
-
11
-
12
-
13
-
14
-
15
-
16
-
17
-
18
-
19
-
20
-
21
-
22
-
23
-
24
-
25
-
26
-
27
-
28
-
29
-
30
-
31
-
32
-
33
-
34
-
35
-
36
-
37
-
38
-
39
-
40
-
41
-
42
-
43
-
44
-
45
-
46
-
47
-
 48
48 -
 49
49 -
 50
50 -
 51
51 -
 52
52 -
 53
53 -
 54
54 -
 55
55 -
 56
56 -
 57
57 -
 58
58 -
 59
59 -
 60
60 -
 61
61 -
 62
62 -
 63
63 -
 64
64 -
 65
65 -
 66
66 -
 67
67 -
 68
68 -
69
-
70
-
71
-
72
-
73
-
74
-
75
-
76
-
77
-
78
-
79
-
80
-
81
-
82
-
83
-
84
-
85
-
86
-
87
-
88
-
89
-
90
-
91
-
92
-
93
-
94
-
95
-
96
-
97
-
98
-
99
-
100
-
101
-
102
-
103
-
104
-
105
-
106
-
107
-
108
-
109
-
110
-
111
-
112
-
113
-
114
-
115
-
116
-
117
-
118
-
119
-
120
-
121
-
122
-
123
-
124
-
125
-
126
-
127
-
128
-
129
-
130
-
131
-
132
-
133
-
134
-
135
-
136
-
137
-
138
-
139
-
140
-
141
-
142
-
143
-
144
-
145
-
146
-
147
 |
 |
36
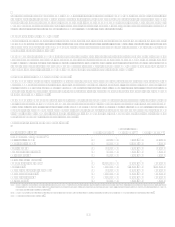
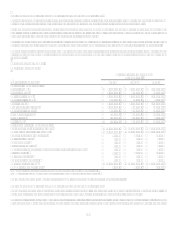
Interchange
Interchange income, net of rewards expense, decreased 9% for the year ended December 31, 2007 due to decreases in reported
purchase volume of 3% and higher costs associated with our rewards programs of 3%. Managed U.S. Card purchase volume increased
3% compared to 2006. Costs associated with the Companys rewards programs were $182.9 million in 2007.
Interchange income, net of rewards expense, increased 7% for the year ended December 31, 2006, compared to 2005. This increase is
primarily related to a 13% increase in purchase volume. Costs associated with the Companys rewards programs were $176.3 million
and $176.9 million for the years ended December 31, 2006 and 2005, respectively.
Other Non-Interest Income
Other non-interest income includes, among other items, gains and losses on sales of securities, gains and losses associated with
hedging transactions, revenue generated by our healthcare finance business and income earned from purchased charged-off loan
portfolios.
Other non-interest income for the year ended December 31, 2007, increased $194.4 million or 66%. The increase is primarily due to
the North Fork acquisition. Other non-interest income for 2007 also includes a $46.2 million gain from the sale of a stake in
DealerTrack Holding Inc., a $41.6 million gain on sale of our interest in a relationship agreement to develop and market consumer
credit products in Spain and gains from sales of MasterCard stock of $43.4 million.
Other non-interest income for the year ended December 31, 2006, increased $31.9 million from 2005. The increase was primarily the
result of a $59.8 million gain from the sale of purchased charged-off loan portfolios, a $20.5 million gain from the share redemption in
connection with the MasterCard, Inc. initial public offering, a $28.6 million increase in the revenue related to back end performance
bonuses related to prior period auto loan sales compared to same periods in prior years, offset by a $50.1 million negative fair value
adjustment on the derivatives instruments entered into in anticipation of the North Fork acquisition, and a $12.4 million loss recorded
in connection with the extinguishment of senior notes during the first quarter of 2006, and $12.4 million income recognized in the
prior year from the Companys charged off loan portfolio which was disposed of in February 2006.
Provision for loan and lease losses
Provision for loan and lease losses increased $1.2 billion, or 79% for the year ended December 31, 2007. The increase in provision is a
result of the continued normalization of consumer credit following the unusually favorable credit environment in 2006, adverse
charge-off and delinquency trends in our National Lending businesses and the increase in our coverage ratio of allowance to loans
held for investment as a result of economic weakening in the latter part of 2007 as evidenced by increased delinquency rates and
consistent with recently released economic indicators.
Exclusive of the North Fork acquisition, the provision for loan losses decreased 1% for the year ended December 31, 2006, compared
to the prior year. The decrease in the provision compared to 2005 is as a result of a continued increase in the concentration of higher
credit quality loans in the reported loan portfolio combined with a continued favorable loss environment resulting from, in part, a
slower than expected return of bankruptcy related charge-offs to historical levels. During 2006, the Company determined that $25.7
million of allowance for loan losses previously established to cover expected losses in the portion of the loan portfolio impacted by the
2005 hurricanes was no longer needed.
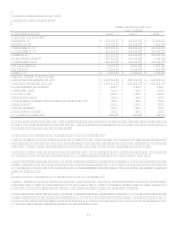
Non-interest expense
Non-interest expense consists of marketing, restructuring and operating expenses.
For the year ended December 31, 2007, non-interest expense increased 16%, reflecting a 22% increase in operating expenses and a 7%
decrease in marketing expense. Non-interest expense increased $1.1 billion to $8.1 billion for the year ended December 31, 2007. The
increase in operating expense was driven by the addition of North Forks operating expenses, CDI amortization and integration
expenses associated with our bank acquisitions, litigation accruals related to industry litigation, restructuring charges associated with
our 2007 cost initiative, and the accelerated vesting of restricted stock related to the transition to new management in our Local
Banking business.
Non-interest expense increased 21% for the year ended December 31, 2006 compared to 2005, reflecting a 5% increase in marketing
spend and a 27% increase in operating expenses. Non-interest expense increased $1.2 billion in 2006, of which $0.9 billion reflected a
full years worth of Hibernias operations and $100 million from the North Fork acquisition.
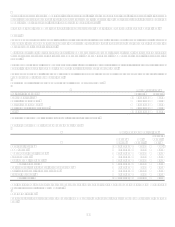
Income Taxes
The Companys effective tax rate was 33.0%, 33.9% and 36.1% for the years ended December 31, 2007, 2006 and 2005, respectively.
The effective rate includes federal, state, and international tax components. The decrease in the 2007 rate compared to the 2006 rate