Capital One 2007 Annual Report Download - page 69
Download and view the complete annual report
Please find page 69 of the 2007 Capital One annual report below. You can navigate through the pages in the report by either clicking on the pages listed below, or by using the keyword search tool below to find specific information within the annual report.-
 1
1 -
2
-
3
-
4
-
5
-
6
-
7
-
8
-
9
-
10
-
11
-
12
-
13
-
14
-
15
-
16
-
17
-
18
-
19
-
20
-
21
-
22
-
23
-
24
-
25
-
26
-
27
-
28
-
29
-
30
-
31
-
32
-
33
-
34
-
35
-
36
-
37
-
38
-
39
-
40
-
41
-
42
-
43
-
44
-
45
-
46
-
47
-
48
-
49
-
50
-
51
-
52
-
53
-
54
-
55
-
56
-
57
-
58
-
 59
59 -
 60
60 -
 61
61 -
 62
62 -
 63
63 -
 64
64 -
 65
65 -
 66
66 -
 67
67 -
 68
68 -
 69
69 -
 70
70 -
 71
71 -
 72
72 -
 73
73 -
 74
74 -
 75
75 -
 76
76 -
 77
77 -
 78
78 -
 79
79 -
80
-
81
-
82
-
83
-
84
-
85
-
86
-
87
-
88
-
89
-
90
-
91
-
92
-
93
-
94
-
95
-
96
-
97
-
98
-
99
-
100
-
101
-
102
-
103
-
104
-
105
-
106
-
107
-
108
-
109
-
110
-
111
-
112
-
113
-
114
-
115
-
116
-
117
-
118
-
119
-
120
-
121
-
122
-
123
-
124
-
125
-
126
-
127
-
128
-
129
-
130
-
131
-
132
-
133
-
134
-
135
-
136
-
137
-
138
-
139
-
140
-
141
-
142
-
143
-
144
-
145
-
146
-
147
 |
 |

47
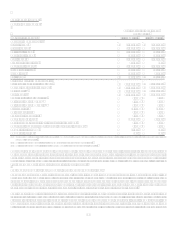
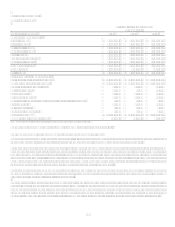
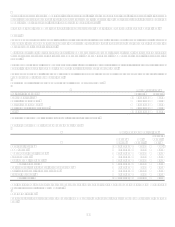
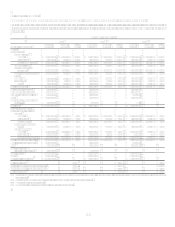
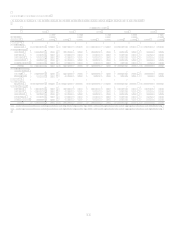
Table 10: Short Term Borrowings
(Dollars in Thousands)
Maximum
Outstanding
as of any
Month-End
Outstanding
as of
Year-End
Average
Outstanding
Average
Interest
Rate
Year-End
Weighted
Average
Interest
Rate
2007:
Federal funds purchased and resale
agreements $ 3,504,745 $ 683,186 $ 1,689,647 4.74% 3.19%
Other 4,345,490 4,345,490 2,635,113 5.91 5.88
Total $ 5,028,676 $ 4,324,760 5.45% 5.51%
2006:
Federal funds purchased and resale
agreements $ 3,736,470 $ 3,736,470 $ 1,662,961 4.20% 5.27%
Other 3,198,710 1,716,055 1,323,998 5.75 5.89
Total $ 5,452,525 $ 2,986,959 4.89% 5.28%
2005:
Federal funds purchased and resale
agreements $ 2,332,173 $ 745,719 $ 704,458 2.69% 3.62%
Other 1,453,181 1,271,014 840,860 4.88 2.09
Total $ 2,016,733 $ 1,545,318 3.88% 2.66%
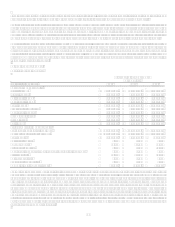
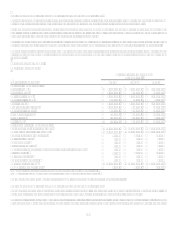
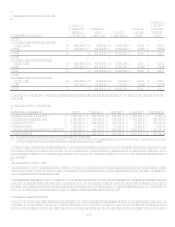
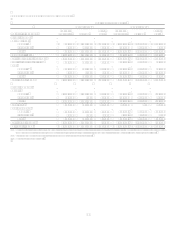
Table 11 summarizes the amounts and maturities of the contractual funding obligations of the Company, including off-balance sheet
funding.
Table 11: Funding Obligations
As of December 31, 2007 Total Up to 1 year 1-3 years 4-5 years After 5 years
Interest-bearing time deposits(1) $ 29,104,759 $ 18,871,926 $ 7,859,207 $ 1,710,740 $ 662,886
Senior and subordinated notes 10,712,706 1,808,760 2,361,793 1,801,426 4,740,727
Other borrowings(2) 26,583,683 15,250,370 9,545,088 482,912 1,305,313
Operating leases 1,165,352 145,153 250,728 201,728 567,743
Off-balance sheet securitization amortization 48,864,562 9,447,921 16,632,890 10,590,612 12,193,139
Total obligations $ 116,431,062 $ 45,524,130 $ 36,649,706 $ 14,787,418 $ 19,469,808
(1) Includes only those interest bearing deposits which have a contractual maturity date.
(2) Other borrowings includes secured borrowings for the Companys on-balance sheet auto loan securitizations, junior subordinated capital income securities and debentures,
FHLB advances, federal funds purchased and resale agreements and other short-term borrowings.
The terms of the lease and credit facility agreements related to certain other borrowings and operating leases in Table 10 require
several financial covenants (including performance measures and equity ratios) to be met. If these covenants are not met, there may be
an acceleration of the payment due dates noted above. As of December 31, 2007, the Company was not in default of any such
covenants.
Liquidity Risk Management
Liquidity risk management refers to the way the Company manages the use and availability of various funding sources to meet its
current and future operating needs. These needs are largely a result of asset growth, securitization, debt and deposit maturities, and
payments of other corporate obligations.
To facilitate liquidity risk management, the Company uses a variety of funding sources to establish a maturity pattern that provides a
prudent mixture of short-term and long-term funds. The Company obtains funds through the gathering of deposits, issuing debt and
equity, and securitizing assets. Further liquidity is provided to the Company through committed facilities. As of December 31, 2007,
the Company had over $11.4 billion in unused conduit capacity available for liquidity needs.
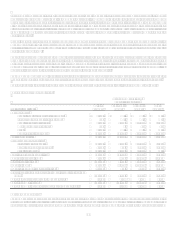
Securities Available for Sale
The Company held $10.5 billion in available for sale investment securities, net of $9.3 billion in pledged available-for-sale investment
securities and $4.8 billion of cash and cash equivalents at December 31, 2007, compared to $6.0 billion in available-for-sale
investment securities, net of $9.5 billion in pledged available-for-sale investment securities and $4.7 billion of cash and cash