Capital One 2007 Annual Report Download - page 65
Download and view the complete annual report
Please find page 65 of the 2007 Capital One annual report below. You can navigate through the pages in the report by either clicking on the pages listed below, or by using the keyword search tool below to find specific information within the annual report.-
 1
1 -
2
-
3
-
4
-
5
-
6
-
7
-
8
-
9
-
10
-
11
-
12
-
13
-
14
-
15
-
16
-
17
-
18
-
19
-
20
-
21
-
22
-
23
-
24
-
25
-
26
-
27
-
28
-
29
-
30
-
31
-
32
-
33
-
34
-
35
-
36
-
37
-
38
-
39
-
40
-
41
-
42
-
43
-
44
-
45
-
46
-
47
-
48
-
49
-
50
-
51
-
52
-
53
-
54
-
 55
55 -
 56
56 -
 57
57 -
 58
58 -
 59
59 -
 60
60 -
 61
61 -
 62
62 -
 63
63 -
 64
64 -
 65
65 -
 66
66 -
 67
67 -
 68
68 -
 69
69 -
 70
70 -
 71
71 -
 72
72 -
 73
73 -
 74
74 -
 75
75 -
76
-
77
-
78
-
79
-
80
-
81
-
82
-
83
-
84
-
85
-
86
-
87
-
88
-
89
-
90
-
91
-
92
-
93
-
94
-
95
-
96
-
97
-
98
-
99
-
100
-
101
-
102
-
103
-
104
-
105
-
106
-
107
-
108
-
109
-
110
-
111
-
112
-
113
-
114
-
115
-
116
-
117
-
118
-
119
-
120
-
121
-
122
-
123
-
124
-
125
-
126
-
127
-
128
-
129
-
130
-
131
-
132
-
133
-
134
-
135
-
136
-
137
-
138
-
139
-
140
-
141
-
142
-
143
-
144
-
145
-
146
-
147
 |
 |
43
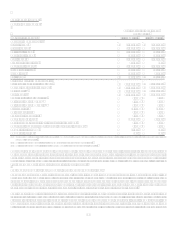
Originations in 2007 were $13.2 billion, 7% higher than prior year. As a result of this portfolio growth, net interest income increased
10% during 2007 compared to 2006.
Non-interest income for 2007 included a one-time gain of $46.2 million related to the sale of 1.8 million shares of DealerTrack.
During 2007, the Auto Finance sub-segments net charge-off rate was 3.06%, up 78 basis points from 2.28% during 2006. Net charge-
offs of loans outstanding increased $272.8 million, or 58%, while average loans outstanding during 2007 grew $3.7 billion, or 18%,
compared to 2006. The 30-plus day delinquency rate was up 149 basis points at December 31, 2007. The adverse credit performance
is mainly driven by credit normalization following the unusually favorable credit environment in 2006 and elevated losses from the
recent Dealer Prime originations and the Dealer Subprime business. While the Dealer Prime loans being originated today have better
credit characteristics compared to loans originated a year ago, loss levels from loans originated in 2006 will remain elevated until the
loans amortize. Elevated losses in the Dealer Subprime business are a result of industry-wide risk and underwriting expansions of the
past several years. While losses on these loans have increased, the business remains profitable and risk adjusted returns remain within
the Companys expectations. The provision for loan losses increased $561.3 million, or 113% during 2007. This increase was driven
by a weakening U.S. economy, growth in the loan portfolio, and elevated losses from discontinued programs in our Prime segment, as
well as moderately worse credit quality in Subprime.
Non-interest expense increased 3% during 2007, compared to 12% revenue growth for 2006. Operating costs as a percent of loans
have declined from 2.8% during the first quarter of 2007 to 2.3% during the fourth quarter of 2007 as the Auto Finance sub-segment
realized the benefits of the integration of the dealer programs of the legacy Capital One, Onyx, Hibernia, and North Fork auto lending
businesses.
Year Ended December 31, 2006 Compared to Year Ended December 31, 2005
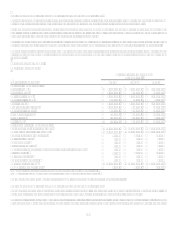
Net income for the Auto Finance sub-segment increased $101.5 million, or 77% during 2006, as a result of portfolio growth,
improvement in loan loss performance and additional scale gained in non interest expense. The increase was partially offset by margin
compression due to the increasing rate environment, heightened competition, and the acquisition of Hibernias indirect auto loans,
which increased the Auto Finance sub-segment mix of prime loans.
The Auto Finance sub-segments loan portfolio increased 33% year over year as a result of the 2006 addition of Hibernias indirect
auto loan portfolio, as well as strong organic originations growth within the dealer marketing channels.
For 2006, the net charge-off rate was 2.28%, down 42 basis points from 2.70% in 2005. Net charge-offs of loans outstanding increased
$84.4 million, or 22%, while average loans grew $6.3 billion, or 45%, during 2006 compared to 2005. The decrease in the charge-off
rate was primarily driven by improved loan quality through the acquisition of Hibernias indirect auto loans, which increased the mix
of prime loans, and decreases in bankruptcy related charge-offs which were lower than historical levels following the bankruptcy
filing spike experienced in the fourth quarter of 2005. The provision for loan losses increased $35.3 million, or 8% during 2006. This
increase was driven by growth in the loan portfolio, partially offset by a reduction in allowance for loan losses as a result of
implementing a consistent reserve policy on the Hibernia indirect auto portfolio.
Non-interest expense increased 18% during 2006, due to growth in the loan portfolio. However, loan growth versus prior year
outpaced the increase in non-interest expense as the Auto Finance sub-segment experienced greater cost efficiency, while 2005
included incremental operating and integration expenses related to the 2005 acquisitions.
The 30-plus day delinquency rate for the Auto Finance sub-segment was up 64 basis points to 6.35% at December 31, 2006. The
increase in delinquencies was the result of the gradual normalization of delinquencies following the 2005 bankruptcy spike and
targeted risk expansion in non-prime markets.