Capital One 2007 Annual Report Download - page 85
Download and view the complete annual report
Please find page 85 of the 2007 Capital One annual report below. You can navigate through the pages in the report by either clicking on the pages listed below, or by using the keyword search tool below to find specific information within the annual report.-
 1
1 -
2
-
3
-
4
-
5
-
6
-
7
-
8
-
9
-
10
-
11
-
12
-
13
-
14
-
15
-
16
-
17
-
18
-
19
-
20
-
21
-
22
-
23
-
24
-
25
-
26
-
27
-
28
-
29
-
30
-
31
-
32
-
33
-
34
-
35
-
36
-
37
-
38
-
39
-
40
-
41
-
42
-
43
-
44
-
45
-
46
-
47
-
48
-
49
-
50
-
51
-
52
-
53
-
54
-
55
-
56
-
57
-
58
-
59
-
60
-
61
-
62
-
63
-
64
-
65
-
66
-
67
-
68
-
69
-
70
-
71
-
72
-
73
-
74
-
 75
75 -
 76
76 -
 77
77 -
 78
78 -
 79
79 -
 80
80 -
 81
81 -
 82
82 -
 83
83 -
 84
84 -
 85
85 -
 86
86 -
 87
87 -
 88
88 -
 89
89 -
 90
90 -
 91
91 -
 92
92 -
 93
93 -
 94
94 -
 95
95 -
96
-
97
-
98
-
99
-
100
-
101
-
102
-
103
-
104
-
105
-
106
-
107
-
108
-
109
-
110
-
111
-
112
-
113
-
114
-
115
-
116
-
117
-
118
-
119
-
120
-
121
-
122
-
123
-
124
-
125
-
126
-
127
-
128
-
129
-
130
-
131
-
132
-
133
-
134
-
135
-
136
-
137
-
138
-
139
-
140
-
141
-
142
-
143
-
144
-
145
-
146
-
147
 |
 |

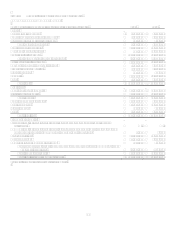
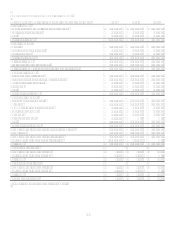
63
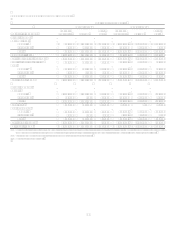
CONSOLIDATED STATEMENTS OF INCOME
Year Ended December 31 (In Thousands, Except Per Share Data) 2007 2006 2005
Interest Income:
Loans held for investment, including past-due fees $ 9,500,128 $ 7,046,473 $ 5,010,839
Securities available for sale 950,972 676,712 386,896
Other 627,056 441,550 329,146
Total interest income 11,078,156 8,164,735 5,726,881
Interest Expense:
Deposits 2,906,351 1,814,797 1,173,137
Senior and subordinated notes 577,128 411,643 421,218
Other borrowings 1,064,832 846,849 452,284
Total interest expense 4,548,311 3,073,289 2,046,639
Net interest income 6,529,845 5,091,446 3,680,242
Provision for loan and lease losses 2,636,502 1,476,438 1,491,072
Net interest income after provision for loan and lease losses 3,893,343 3,615,008 2,189,170
Non-Interest Income:
Servicing and securitizations 4,840,677 4,209,637 3,945,183
Service charges and other customer-related fees 2,057,854 1,770,340 1,493,690
Mortgage servicing and other 166,776 177,893 142,894
Interchange 500,484 549,074 514,196
Other 488,432 294,080 262,142
Total non-interest income 8,054,223 7,001,024 6,358,105
Non-Interest Expense:
Salaries and associate benefits 2,592,534 2,224,676 1,749,738
Marketing 1,347,836 1,444,324 1,379,938
Communications and data processing 758,820 712,001 580,992
Supplies and equipment 531,238 460,419 355,734
Occupancy 322,510 215,636 152,090
Restructuring expense 138,237
Other 2,386,835 1,886,635 1,499,781
Total non-interest expense 8,078,010 6,943,691 5,718,273
Income from continuing operations before income taxes 3,869,556 3,672,341 2,829,002
Income taxes 1,277,837 1,245,964 1,019,855
Income from continuing operations, net of tax 2,591,719 2,426,377 1,809,147
Loss from discontinued operations, net of tax (1,021,387) (11,884)
Net income $ 1,570,332 $ 2,414,493 $ 1,809,147
Basic earnings per share
Income from continuing operations $ 6.64 $ 7.84 $ 6.98
Loss from discontinued operations (2.62) (0.04)
Net income $ 4.02 $ 7.80 $ 6.98
Diluted earnings per share
Income from continuing operations $ 6.55 $ 7.65 $ 6.73
Loss from discontinued operations (2.58) (0.03)
Net income $ 3.97 $ 7.62 $ 6.73
Dividends paid per share $ 0.11 $ 0.11 $ 0.11
See Notes to Consolidated Financial Statements.