Capital One 2007 Annual Report Download - page 42
Download and view the complete annual report
Please find page 42 of the 2007 Capital One annual report below. You can navigate through the pages in the report by either clicking on the pages listed below, or by using the keyword search tool below to find specific information within the annual report.-
 1
1 -
2
-
3
-
4
-
5
-
6
-
7
-
8
-
9
-
10
-
11
-
12
-
13
-
14
-
15
-
16
-
17
-
18
-
19
-
20
-
21
-
22
-
23
-
24
-
25
-
26
-
27
-
28
-
29
-
30
-
31
-
 32
32 -
 33
33 -
 34
34 -
 35
35 -
 36
36 -
 37
37 -
 38
38 -
 39
39 -
 40
40 -
 41
41 -
 42
42 -
 43
43 -
 44
44 -
 45
45 -
 46
46 -
 47
47 -
 48
48 -
 49
49 -
 50
50 -
 51
51 -
 52
52 -
53
-
54
-
55
-
56
-
57
-
58
-
59
-
60
-
61
-
62
-
63
-
64
-
65
-
66
-
67
-
68
-
69
-
70
-
71
-
72
-
73
-
74
-
75
-
76
-
77
-
78
-
79
-
80
-
81
-
82
-
83
-
84
-
85
-
86
-
87
-
88
-
89
-
90
-
91
-
92
-
93
-
94
-
95
-
96
-
97
-
98
-
99
-
100
-
101
-
102
-
103
-
104
-
105
-
106
-
107
-
108
-
109
-
110
-
111
-
112
-
113
-
114
-
115
-
116
-
117
-
118
-
119
-
120
-
121
-
122
-
123
-
124
-
125
-
126
-
127
-
128
-
129
-
130
-
131
-
132
-
133
-
134
-
135
-
136
-
137
-
138
-
139
-
140
-
141
-
142
-
143
-
144
-
145
-
146
-
147
 |
 |

20
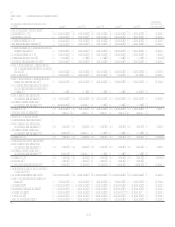
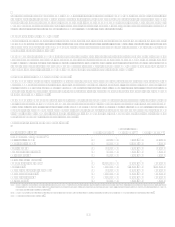
Item 6. Selected Financial Data
(Dollars in millions, Except Per Share
Data) 2007 2006(5) 2005(4) 2004 2003
Five Year
Compound
Growth Rate
Income Statement Data:
Interest income $ 11,078.1 $ 8,164.7 $ 5,726.9 $ 4,794.4 $ 4,367.7 20.46%
Interest expense 4,548.3 3,073.3 2,046.6 1,791.4 1,582.6 23.51%
Net interest income 6,529.8 5,091.4 3,680.3 3,003.0 2,785.1 18.58%
Provision for loan losses 2,636.5 1,476.4 1,491.1 1,220.9 1,517.5 11.68%
N
et interest income after provision
for loan losses 3,893.3 3,615.0 2,189.2 1,782.1 1,267.6 25.16%
Non-interest income 8,054.2 7,001.0 6,358.1 5,900.2 5,415.9 8.26%
Restructuring expense 138.2 N/A
Other non-interest expense 7,939.8 6,943.6 5,718.3 5,322.2 4,856.7 10.33%
Income before income taxes and
cumulative effect of accounting
change 3,869.5 3,672.4 2,829.0 2,360.1 1,826.8 16.20%
Income taxes 1,277.8 1,246.0 1,019.9 816.6 676.0 13.58%
Income before cumulative effect
of accounting change 2,591.7 2,426.4 1,809.1 1,543.5 1,150.8 17.63%
Cumulative effect of accounting
change, net of taxes of $8.8
million 15.0
Income from continuing
operations, net of tax $ 2,591.7 $ 2,426.4 $ 1,809.1 $ 1,543.5 $ 1,135.8 17.94%
Loss from discontinued
operations, net of tax(6) (1,021.4) (11.9)
Net income $ 1,570.3 $ 2,414.5 $ 1,809.1 $ 1,543.5 $ 1,135.8 6.69%
Dividend payout ratio 2.68% 1.34% 1.52% 1.66% 2.14%
Per Common Share:
Basic earnings per share:
Income from continuing
operations, net of tax $ 6.64 $ 7.84 $ 6.98 $ 6.55 $ 5.05 5.63%
Loss from discontinued
operations, net of tax(6) (2.62) (0.04)
Net income $ 4.02 $ 7.80 $ 6.98 $ 6.55 $ 5.05 (4.44)%
Diluted earnings per share:
Income from continuing
operations, net of tax $ 6.55 $ 7.65 $ 6.73 $ 6.21 $ 4.85 6.20%
Loss from discontinued
operations, net of tax(6) (2.58) (0.03)
Net income $ 3.97 $ 7.62 $ 6.73 $ 6.21 $ 4.85 (3.92)%
Dividends 0.11 0.11 0.11 0.11 0.11
Book value as of year-end 65.18 61.56 46.97 33.99 25.75 20.41%
Selected Year-End Reported
Balances(3):
Loans held for investment $ 101,805.0 $ 96,512.1 $ 59,847.7 $ 38,215.6 $ 32,850.3 25.39%
Allowance for loan and lease
losses 2,963.0 2,180.0 1,790.0 1,505.0 1,595.0 13.19%
Total assets 150,499.1 144,360.8 88,701.4 53,747.3 46,283.7 26.60%
Interest-bearing deposits 71,943.9 74,122.8 43,092.1 25,636.8 22,416.3 26.27%
Total deposits 82,990.5 85,770.9 47,933.3 25,636.8(2) 22,416.3(2) 29.93%
Borrowings 37,261.9 29,667.9 22,278.1 16,511.8 14,812.6 20.26%
Stockholders equity 24,294.1 25,235.2 14,128.9 8,388.2 6,051.8 32.05%