Capital One 2007 Annual Report Download - page 68
Download and view the complete annual report
Please find page 68 of the 2007 Capital One annual report below. You can navigate through the pages in the report by either clicking on the pages listed below, or by using the keyword search tool below to find specific information within the annual report.-
 1
1 -
2
-
3
-
4
-
5
-
6
-
7
-
8
-
9
-
10
-
11
-
12
-
13
-
14
-
15
-
16
-
17
-
18
-
19
-
20
-
21
-
22
-
23
-
24
-
25
-
26
-
27
-
28
-
29
-
30
-
31
-
32
-
33
-
34
-
35
-
36
-
37
-
38
-
39
-
40
-
41
-
42
-
43
-
44
-
45
-
46
-
47
-
48
-
49
-
50
-
51
-
52
-
53
-
54
-
55
-
56
-
57
-
 58
58 -
 59
59 -
 60
60 -
 61
61 -
 62
62 -
 63
63 -
 64
64 -
 65
65 -
 66
66 -
 67
67 -
 68
68 -
 69
69 -
 70
70 -
 71
71 -
 72
72 -
 73
73 -
 74
74 -
 75
75 -
 76
76 -
 77
77 -
 78
78 -
79
-
80
-
81
-
82
-
83
-
84
-
85
-
86
-
87
-
88
-
89
-
90
-
91
-
92
-
93
-
94
-
95
-
96
-
97
-
98
-
99
-
100
-
101
-
102
-
103
-
104
-
105
-
106
-
107
-
108
-
109
-
110
-
111
-
112
-
113
-
114
-
115
-
116
-
117
-
118
-
119
-
120
-
121
-
122
-
123
-
124
-
125
-
126
-
127
-
128
-
129
-
130
-
131
-
132
-
133
-
134
-
135
-
136
-
137
-
138
-
139
-
140
-
141
-
142
-
143
-
144
-
145
-
146
-
147
 |
 |

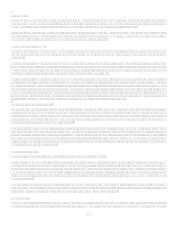
46
representing preferred stock, common stock, trust preferred securities, junior subordinated debt securities, guarantees of trust preferred
securities and certain back-up obligations, purchase contracts and units. There is no limit under this shelf registration statement to the
amount or number of such securities that the Corporation may offer and sell.
In September 2007, the Company issued $1.5 billion aggregate principal amount of 6.75% Senior Notes due September 15, 2017.
Deposits
The Company continues to expand its retail deposit gathering efforts through its direct marketing channels, the existing branch
network and through De Novo branch expansion. Deposits from the direct marketing business continued to grow due to expansion in
marketed channels, such as the internet.
With the acquisitions of North Fork and Hibernia, the Company acquired new channels for deposit growth. The branch network offers
a broad set of deposit products that include demand deposits, money market deposits, NOW accounts, and certificates of deposits
(CDs).
As of December 31, 2007, the Company had $83.0 billion in deposits of which $3.6 billion were held in foreign banking offices and
$10.0 billion represented large domestic denomination certificates of $100 thousand or more.
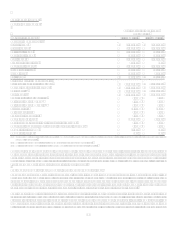
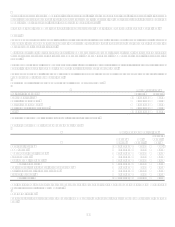
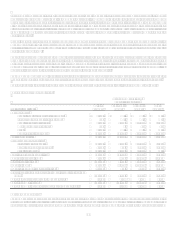
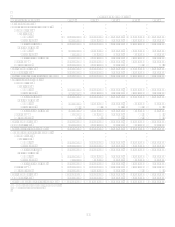
Table 8 shows the maturities of domestic time certificates of deposit in denominations of $100 thousand or greater (large
denomination CDs) as of December 31, 2007.
Table 8: Maturities of Large Denomination Certificates$100,000 or More
December 31, 2007
(Dollars in thousands) Balance Percent
Three months or less $ 2,846,368 28.4%
Over 3 through 6 months 1,934,166 19.3%
Over 6 through 12 months 2,360,003 23.5%
Over 12 months through 10 years 2,888,811 28.8%
Total $ 10,029,348 100.0%
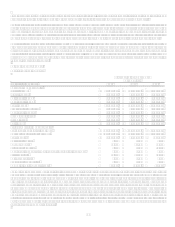
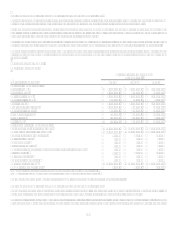
Table 9 shows the composition of average deposits for the periods presented.
Table 9: Deposit Composition and Average Deposit Rates
Year Ended December 31, 2007
Average
Balance
% of
Deposits
Average
Deposit
Rate
Non-interest bearing $ 11,446,705 13.40% N/A
NOW accounts 4,902,599 5.74% 2.79%
Money market deposit accounts 27,707,162 32.43% 3.94%
Savings Accounts 8,327,672 9.75% 1.70%
Other consumer time deposits 17,905,485 20.96% 4.52%
Total core deposits 70,289,623 82.28% 3.10%
Public fund certificate of deposits of $100,000 or more 1,951,412 2.28% 5.09%
Certificates of deposit of $100,000 or more 9,233,313 10.81% 4.62%
Foreign time deposits 3,952,877 4.63% 5.10%
Total deposits $ 85,427,225 100.00% 3.40%
Additional information regarding funding can be found in Item 8 Financial Statements and Supplementary DataNotes to the
Consolidated Financial StatementsNote 9.
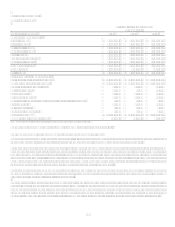
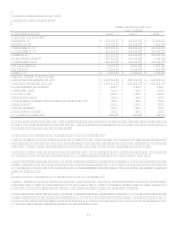
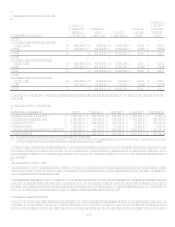
Funding Obligations
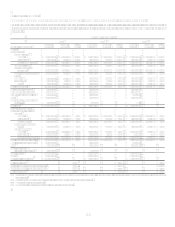
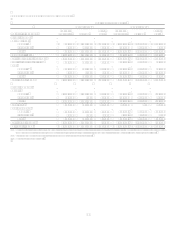
Table 10 reflects the costs of other borrowings of the Company as of and for each of the years ended December 31, 2007, 2006 and
2005.