Capital One 2007 Annual Report Download - page 87
Download and view the complete annual report
Please find page 87 of the 2007 Capital One annual report below. You can navigate through the pages in the report by either clicking on the pages listed below, or by using the keyword search tool below to find specific information within the annual report.-
 1
1 -
2
-
3
-
4
-
5
-
6
-
7
-
8
-
9
-
10
-
11
-
12
-
13
-
14
-
15
-
16
-
17
-
18
-
19
-
20
-
21
-
22
-
23
-
24
-
25
-
26
-
27
-
28
-
29
-
30
-
31
-
32
-
33
-
34
-
35
-
36
-
37
-
38
-
39
-
40
-
41
-
42
-
43
-
44
-
45
-
46
-
47
-
48
-
49
-
50
-
51
-
52
-
53
-
54
-
55
-
56
-
57
-
58
-
59
-
60
-
61
-
62
-
63
-
64
-
65
-
66
-
67
-
68
-
69
-
70
-
71
-
72
-
73
-
74
-
75
-
76
-
 77
77 -
 78
78 -
 79
79 -
 80
80 -
 81
81 -
 82
82 -
 83
83 -
 84
84 -
 85
85 -
 86
86 -
 87
87 -
 88
88 -
 89
89 -
 90
90 -
 91
91 -
 92
92 -
 93
93 -
 94
94 -
 95
95 -
 96
96 -
 97
97 -
98
-
99
-
100
-
101
-
102
-
103
-
104
-
105
-
106
-
107
-
108
-
109
-
110
-
111
-
112
-
113
-
114
-
115
-
116
-
117
-
118
-
119
-
120
-
121
-
122
-
123
-
124
-
125
-
126
-
127
-
128
-
129
-
130
-
131
-
132
-
133
-
134
-
135
-
136
-
137
-
138
-
139
-
140
-
141
-
142
-
143
-
144
-
145
-
146
-
147
 |
 |

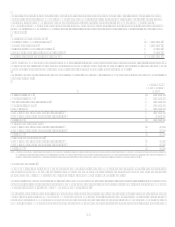
65
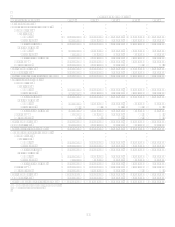
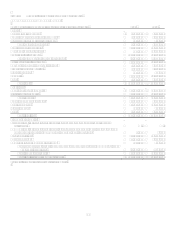
CONSOLIDATED STATEMENTS OF CASH FLOWS
Year Ended December 31 (In Thousands) 2007 2006 2005
Operating Activities:
Income from continuing operations, net of tax $ 2,591,719 $ 2,426,377 $ 1,809,147
Loss from discontinued operations, net of tax (1,021,387) (11,884)
Net Income 1,570,332 2,414,493 1,809,147
Adjustments to reconcile net income to cash provided by operating activities:
Provision for loan losses 2,636,502 1,476,438 1,491,072
Depreciation and amortization, net 678,757 542,090 425,640
Impairment of long-lived assets 13,272
(Gains) losses on sales of securities available for sale (69,976) 29,203 6,817
Gains on sales of auto loans (10,960) (28,609) (14,087)
Gains on extinguishment of debt (17,444)
Losses on repurchase of senior notes 12,444
Mortgage loans held for sale:
Transfers in and originations (404,831) (4,625,378) (197,444)
Gains on sales (87,521) (77,285)
Proceeds from sales 6,171,912 3,060,657
Stock plan compensation expense 338,778 211,117 149,496
Changes in assets and liabilities, net of effects from purchase of companies
acquired:
Increase in interest receivable (35,017) (45,311) (180,867)
(Increase) decrease in accounts receivable from securitizations (130,439) 314,425 (658,805)
(Increase) decrease in other assets (2,257,798) 158,060 164,229
Increase in interest payable 56,846 87,005 92,906
Increase (decrease) in other liabilities 1,277,833 (913,446) 550,043
Net cash provided by operating activities attributable to discontinued
operations 3,293,456 773,279
Net cash provided by operating activities 13,010,430 3,376,738 3,663,863
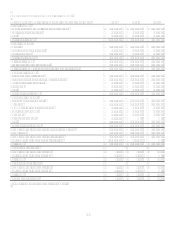
Investing Activities:
Purchases of securities available for sale (12,717,204) (7,777,082) (3,688,180)
Proceeds from maturities of securities available for sale 6,026,680 4,289,139 2,009,517
Proceeds from sales of securities available for sale 2,307,825 6,891,187 909,697
Proceeds from sale of automobile loans 257,230
Proceeds from securitizations of loans 12,641,050 12,343,771 9,482,333
Net increase in loans held for investment (18,895,193) (19,073,474) (16,627,879)
Principal recoveries of loans previously charged off 619,678 547,304 448,351
Additions of premises and equipment, net (437,545) (712,190) (159,823)
Net (payment for) receipt from companies acquired (10,464) (3,635,356) 450,562
Net cash used in investing activities (10,465,173) (7,126,701) (6,918,192)
Financing Activities:
Net (decrease) increase in deposits (2,780,430) 184,830 2,239,553
Net increase in other borrowings 6,624,052 2,006,101 2,923,270
Issuances of senior notes 1,495,740 3,185,272 1,262,035
Maturities of senior notes (462,500) (1,226,882) (876,567)
Repurchases of senior notes (150,000) (31,296) (648,840)
Purchases of treasury stock (3,024,969) (21,615) (40,049)
Dividends paid (42,055) (32,324) (27,504)
Net proceeds from issuances of common stock 43,493 36,751 770,311
Proceeds from share based payment activities 192,361 238,355 312,176
Net cash used in financing activities attributable to discontinued operations (4,280,036)
Net cash (used in) provided by financing activities (2,384,344) 4,339,192 5,914,385
Increase in cash and cash equivalents 160,913 589,229 2,660,056
Cash and cash equivalents at beginning of year 4,660,496 4,071,267 1,411,211
Cash and cash equivalents at end of year $ 4,821,409 $ 4,660,496 $ 4,071,267
See Notes to Consolidated Financial Statements.