Capital One 2007 Annual Report Download - page 104
Download and view the complete annual report
Please find page 104 of the 2007 Capital One annual report below. You can navigate through the pages in the report by either clicking on the pages listed below, or by using the keyword search tool below to find specific information within the annual report.-
 1
1 -
2
-
3
-
4
-
5
-
6
-
7
-
8
-
9
-
10
-
11
-
12
-
13
-
14
-
15
-
16
-
17
-
18
-
19
-
20
-
21
-
22
-
23
-
24
-
25
-
26
-
27
-
28
-
29
-
30
-
31
-
32
-
33
-
34
-
35
-
36
-
37
-
38
-
39
-
40
-
41
-
42
-
43
-
44
-
45
-
46
-
47
-
48
-
49
-
50
-
51
-
52
-
53
-
54
-
55
-
56
-
57
-
58
-
59
-
60
-
61
-
62
-
63
-
64
-
65
-
66
-
67
-
68
-
69
-
70
-
71
-
72
-
73
-
74
-
75
-
76
-
77
-
78
-
79
-
80
-
81
-
82
-
83
-
84
-
85
-
86
-
87
-
88
-
89
-
90
-
91
-
92
-
93
-
 94
94 -
 95
95 -
 96
96 -
 97
97 -
 98
98 -
 99
99 -
 100
100 -
 101
101 -
 102
102 -
 103
103 -
 104
104 -
 105
105 -
 106
106 -
 107
107 -
 108
108 -
 109
109 -
 110
110 -
 111
111 -
 112
112 -
 113
113 -
 114
114 -
115
-
116
-
117
-
118
-
119
-
120
-
121
-
122
-
123
-
124
-
125
-
126
-
127
-
128
-
129
-
130
-
131
-
132
-
133
-
134
-
135
-
136
-
137
-
138
-
139
-
140
-
141
-
142
-
143
-
144
-
145
-
146
-
147
 |
 |

82
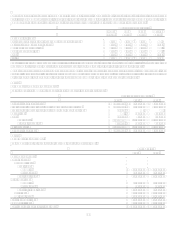
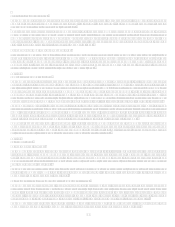
Loans totaling approximately $799.9 million and $573.0 million, representing amounts which were greater than 90 days past due,
were included in the Companys reported loan portfolio as of December 31, 2007 and 2006, respectively. These delinquencies include
nonaccrual consumer auto loans of $593.6 million in 2007, $336.6 million in 2006.
Loans that were considered individually impaired in accordance with SFAS No. 114 at December 31, 2007 and 2006 were $122.8
million and $57.6 million, respectively. The Company had a corresponding specific allowance for loan and lease losses of $8.4 million
and $6.1 million at December 31, 2007 and 2006, respectively, relating to impaired loans of $48.8 million and $41.0 million at
December 31, 2007 and 2006, respectively. The average balance of impaired loans was $74.8 million in 2007 and $65.3 million in
2006. Interest income recognized during 2007 and 2006 related to impaired loans was not material.
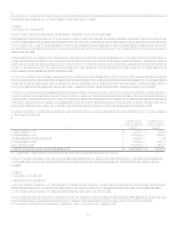
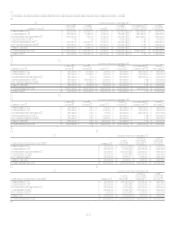
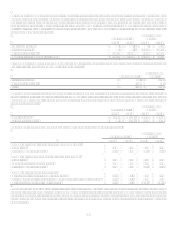
Note 8
Premises and Equipment
Premises and equipment were as follows:
December 31
2007 2006
Land $ 402,422
$ 396,554
Buildings and improvements 1,392,666
1,265,524
Furniture and equipment 1,067,299
1,003,142
Computer software 745,061
786,626
In process 335,755
245,883
3,943,203
3,697,729
Less: Accumulated depreciation and amortization (1,643,600) (1,494,449)
Total premises and equipment, net $ 2,299,603
$ 2,203,280
Depreciation and amortization expense from continuing operations was $308.8 million, $269.6 million, and $210.2 million, for the
years ended December 31, 2007, 2006 and 2005, respectively.
In September 2007, the Company discontinued operations for the majority of the GreenPoint Mortgage business. As a result, the loss
on discontinued operations for 2007 includes the write-off of premises and equipment of $34.6 million (includes $63.3 of write-off in
premises equipment net of $28.7 million of accumulated depreciation and amortization).
As discussed in Note 3Business Combinations, the Company completed its acquisition of North Fork Bank in December 2006. The
acquisition added: $168.5 million in land, $299.4 million in buildings and improvements, $87.2 million of furniture and equipment,
$24.8 million of computer software and $24.8 million of construction in process at December 31, 2006, which are reflected in the
table above.
During 2005, the Company closed on the sale of certain facilities in Seattle, Washington and Tampa, Florida as part of its facility
consolidation efforts. The final sales price of the Tampa, Florida facility was greater than the recorded impaired value, and as such, the
Company reversed $18.8 million of its previously recorded impairment in Occupancy expense during the year ended December 31,
2005.
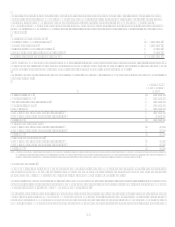
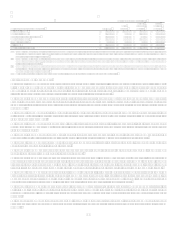
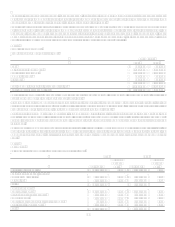
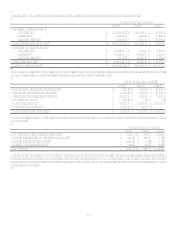
Note 9
Borrowings
Borrowings as of December 31, 2007 and 2006 were as follows:
2007 2006
Outstanding
Weighted
Average
Rate Outstanding
Weighted
Average
Rate
Interest-bearing deposits $ 71,943,913 3.67% $ 74,122,822 3.72%
Senior and subordinated notes
Bank notesfixed rate $ 3,525,699 5.49% $ 3,519,649 5.49%
Corporation 7,187,007 5.75% 6,205,821 5.72%
Total $ 10,712,706
$ 9,725,470
Other borrowings
Secured borrowings $ 13,067,562 4.60% $ 14,532,381 5.19%
Junior subordinated debentures 1,645,656 7.39% 1,623,726 7.92%
FHLB advances 6,841,789 4.63% 2,648,363 5.32%
Federal funds purchased and resale agreements 683,186 3.19% 3,736,470 5.27%
Other short-term borrowings 4,345,490 5.88% 1,716,067 5.89%
Total $ 26,583,683
$ 24,257,007