Capital One 2007 Annual Report Download - page 57
Download and view the complete annual report
Please find page 57 of the 2007 Capital One annual report below. You can navigate through the pages in the report by either clicking on the pages listed below, or by using the keyword search tool below to find specific information within the annual report.-
 1
1 -
2
-
3
-
4
-
5
-
6
-
7
-
8
-
9
-
10
-
11
-
12
-
13
-
14
-
15
-
16
-
17
-
18
-
19
-
20
-
21
-
22
-
23
-
24
-
25
-
26
-
27
-
28
-
29
-
30
-
31
-
32
-
33
-
34
-
35
-
36
-
37
-
38
-
39
-
40
-
41
-
42
-
43
-
44
-
45
-
46
-
 47
47 -
 48
48 -
 49
49 -
 50
50 -
 51
51 -
 52
52 -
 53
53 -
 54
54 -
 55
55 -
 56
56 -
 57
57 -
 58
58 -
 59
59 -
 60
60 -
 61
61 -
 62
62 -
 63
63 -
 64
64 -
 65
65 -
 66
66 -
 67
67 -
68
-
69
-
70
-
71
-
72
-
73
-
74
-
75
-
76
-
77
-
78
-
79
-
80
-
81
-
82
-
83
-
84
-
85
-
86
-
87
-
88
-
89
-
90
-
91
-
92
-
93
-
94
-
95
-
96
-
97
-
98
-
99
-
100
-
101
-
102
-
103
-
104
-
105
-
106
-
107
-
108
-
109
-
110
-
111
-
112
-
113
-
114
-
115
-
116
-
117
-
118
-
119
-
120
-
121
-
122
-
123
-
124
-
125
-
126
-
127
-
128
-
129
-
130
-
131
-
132
-
133
-
134
-
135
-
136
-
137
-
138
-
139
-
140
-
141
-
142
-
143
-
144
-
145
-
146
-
147
 |
 |
35
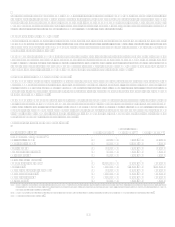
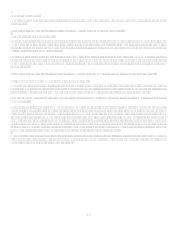
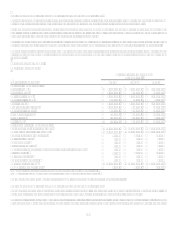
The following discussion provides a summary of 2007 results compared to 2006 results and 2006 results compared to 2005 results on
a continuing operations basis, unless otherwise noted. Each component is discussed in further detail in subsequent sections of this
analysis.
Net interest income
Net interest income is comprised of interest income earned on securities and interest income and past-due fees earned and deemed
collectible from the Companys loans, less interest expense on interest-bearing deposits, senior and subordinated notes, and other
borrowings.
For the year ended December 31, 2007, reported net interest income increased 28%, or $1.4 billion. The increase in net interest
income was driven by the acquisition of North Fork, modest loan growth, and increased margins in the U.S. Card sub-segment due to
selective pricing changes implemented after the completion of our card holder system conversion in 2007. Net interest margin
decreased 68 basis points for the year ended December 31, 2007, primarily due to the addition of the lower net interest margin North
Fork business.
For the year ended December 31, 2006, reported net interest income increased 38%, or $1.4 billion, compared to 2005 inclusive of
$135.1 million from the North Fork acquisition. The increase was due to a 51% increase in reported average earning assets driven by a
full year of Hibernia activity and the December 2006 North Fork acquisition. Net interest margin decreased 57 basis points from
6.63% in 2005 due to spread compression driven primarily by a focus on higher credit quality and a shift in asset mix through recent
acquisitions.
For additional information, see section XII, Tabular Summary, Table A (Statements of Average Balances, Income and Expense,
Yields and Rates) and Table B (Interest Variance Analysis).
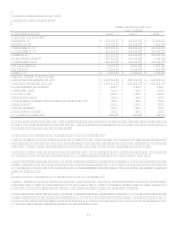
Non-interest income
Non-interest income is comprised of servicing and securitizations income, mortgage servicing and other, service charges and other
customer-related fees, interchange income and other non-interest income.
For the year ended December 31, 2007 and 2006, reported non-interest income increased 15% and 10%, respectively. See detailed
discussion of the components of non-interest income below.
Servicing and Securitizations Income
Servicing and securitizations income represents servicing fees, excess spread and other fees derived from the off-balance sheet loan
portfolio, adjustments to the fair value of retained interests derived through securitization transactions, as well as gains and losses
resulting securitization and other sales transactions.
Servicing and securitizations income increased 15% for the year ended December 31, 2007. This increase was attributable to higher
net gains on sales resulting from higher revenue generated from selective pricing and fee changes in the U.S. card portfolio offset
somewhat by higher charge-offs in the securitized portfolio resulting from continued normalization of credit losses and a 7% increase
in average securitized loans year over year. Average securitized loans were $51.2 billion for 2007 compared to $47.8 billion in 2006.
Servicing and securitizations income increased 7% for the year ended December 31, 2006, compared to 2005. This increase was
primarily the result of a 7% increase in the average off-balance sheet loan portfolio.
Service Charges and Other Customer-Related Fees
For 2007, service charges and other customer-related fees grew 16% due to the inclusion of North Fork and selective pricing changes
in the U.S. Card sub-segment.
For 2006, service charges and other customer-related fees grew 19% or $276.7 million, inclusive of $344.2 million from a full year of
Hibernia activity and $16.8 million from the North Fork acquisition. Excluding the impact of acquisitions, 2006 service charges and
other customer-related fee income declined $84.5 million or 6% from 2005. This was reflective of the reported loan growth being
concentrated in the Auto Finance and Global Financial Services sub-segments that generate lower fee income and lower fee revenue
from U.S. Card.
Mortgage Servicing and Other Income
Mortgage servicing and other is comprised of non-interest income related to our continuing mortgage servicing business and other
mortgage related income. For the year ended December 31, 2007, Mortgage servicing and other income decreased 6% from prior year
due to the changes in fair value of the mortgage servicing rights attributable to the run-off of the portfolio and lack of originations
subsequent to the shutdown of GreenPoints mortgage origination business in 2007.