ICICI Bank 2014 Annual Report Download - page 98
Download and view the complete annual report
Please find page 98 of the 2014 ICICI Bank annual report below. You can navigate through the pages in the report by either clicking on the pages listed below, or by using the keyword search tool below to find specific information within the annual report.-
 1
1 -
2
-
3
-
4
-
5
-
6
-
7
-
8
-
9
-
10
-
11
-
12
-
13
-
14
-
15
-
16
-
17
-
18
-
19
-
20
-
21
-
22
-
23
-
24
-
25
-
26
-
27
-
28
-
29
-
30
-
31
-
32
-
33
-
34
-
35
-
36
-
37
-
38
-
39
-
40
-
41
-
42
-
43
-
44
-
45
-
46
-
47
-
48
-
49
-
50
-
51
-
52
-
53
-
54
-
55
-
56
-
57
-
58
-
59
-
60
-
61
-
62
-
63
-
64
-
65
-
66
-
67
-
68
-
69
-
70
-
71
-
72
-
73
-
74
-
75
-
76
-
77
-
78
-
79
-
80
-
81
-
82
-
83
-
84
-
85
-
86
-
87
-
 88
88 -
 89
89 -
 90
90 -
 91
91 -
 92
92 -
 93
93 -
 94
94 -
 95
95 -
 96
96 -
 97
97 -
 98
98 -
 99
99 -
 100
100 -
 101
101 -
 102
102 -
 103
103 -
 104
104 -
 105
105 -
 106
106 -
 107
107 -
 108
108 -
109
-
110
-
111
-
112
-
113
-
114
-
115
-
116
-
117
-
118
-
119
-
120
-
121
-
122
-
123
-
124
-
125
-
126
-
127
-
128
-
129
-
130
-
131
-
132
-
133
-
134
-
135
-
136
-
137
-
138
-
139
-
140
-
141
-
142
-
143
-
144
-
145
-
146
-
147
-
148
-
149
-
150
-
151
-
152
-
153
-
154
-
155
-
156
-
157
-
158
-
159
-
160
-
161
-
162
-
163
-
164
-
165
-
166
-
167
-
168
-
169
-
170
-
171
-
172
-
173
-
174
-
175
-
176
-
177
-
178
-
179
-
180
-
181
-
182
-
183
-
184
-
185
-
186
-
187
-
188
-
189
-
190
-
191
-
192
-
193
-
194
-
195
-
196
 |
 |

F10
At
31.03.2014
At
31.03.2013
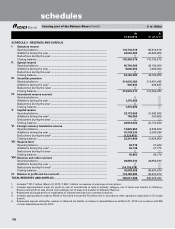
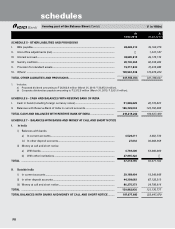
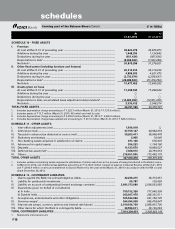
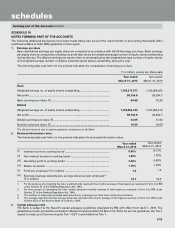
SCHEDULE 10 - FIXED ASSETS
I. Premises
At cost at March 31 of preceding year ..................................................................... 38,822,279 38,625,073
Additions during the year .......................................................................................... 1,448,393 1,124,842
Deductions during the year ....................................................................................... (631,434) (927,636)
Depreciation to date1 .................................................................................................. (8,668,942) (7,543,258)
Net block2 .................................................................................................................... 30,970,296 31,279,021
II. Other fixed assets (including furniture and fixtures)
At cost at March 31 of preceding year ..................................................................... 40,314,014 38,319,238
Additions during the year .......................................................................................... 4,986,935 4,521,473
Deductions during the year ....................................................................................... (2,733,674) (2,526,697)
Depreciation to date3 .................................................................................................. (29,089,823) (27,470,762)
Net block .................................................................................................................... 13,477,452 12,843,252
III. Assets given on lease
At cost at March 31 of preceding year ..................................................................... 17,299,544 17,299,544
Additions during the year .......................................................................................... ——
Deductions during the year ....................................................................................... — —
Depreciation to date, accumulated lease adjustment and provisions4 .................... (14,965,932) (14,951,230)
Net block ..................................................................................................................... 2,333,612 2,348,314
TOTAL FIXED ASSETS ....................................................................................................... 46,781,360 46,470,587
1. Includes depreciation charge amounting to ` 1,222.7 million (March 31, 2013: ` 1,137.0 million).
2. Includes assets of ` 12.7 million (March 31, 2013: Nil) which are held for sale.
3. Includes depreciation charge amounting to ` 4,220.0 million (March 31, 2013: ` 3,436.4 million).
4. Includes depreciation charge/lease adjustment amounting to ` 317.0 million (March 31, 2013: ` 328.2 million).
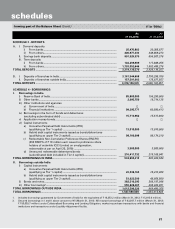
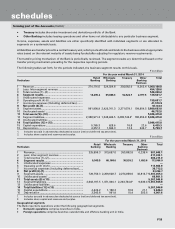
SCHEDULE 11 - OTHER ASSETS
I. Inter-office adjustments (net) ..................................................................................... 1,816,918 —
II. Interest accrued .......................................................................................................... 47,159,107 44,902,010
III. Tax paid in advance/tax deducted at source (net) .................................................... 39,263,411 36,098,478
I V. Stationery and stamps ............................................................................................... 2,995 10,045
V. Non-banking assets acquired in satisfaction of claims1 ........................................... 671,126 576,833
VI. Advances for capital assets ...................................................................................... 936,223 1,154,106
VII. Deposits ...................................................................................................................... 11,123,670 10,868,027
VIII. Deferred tax asset (net)2 ............................................................................................. 7,468,610 24,793,018
IX. Others ......................................................................................................................... 218,651,805 172,468,175
TOTAL OTHER ASSETS ...................................................................................................... 327,093,866 290,870,692
1. Includes certain non-banking assets acquired in satisfaction of claims which are in the process of being transferred in the Bank’s name.
2. At March 31, 2014, net of deferred tax liabilities amounting to ` 14,192.3 million created on balance in Special Reserve at March 31, 2013
and ` 3,042.6 million on amount transferred to Special Reserve for the year ended March 31, 2014 in accordance with the RBI circular
dated December 20, 2013.
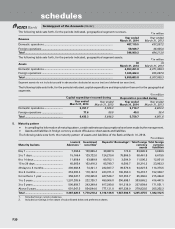
SCHEDULE 12 - CONTINGENT LIABILITIES
I. Claims against the Bank not acknowledged as debts .............................................. 42,236,215 36,373,051
II. Liability for partly paid investments .......................................................................... 65,787 128,050
III. Liability on account of outstanding forward exchange contracts1 ........................... 2,691,373,680 2,838,503,955
I V. Guarantees given on behalf of constituents
a) In India .................................................................................................................... 759,132,326 717,848,338
b) Outside India .......................................................................................................... 262,927,479 226,321,011
V. Acceptances, endorsements and other obligations ................................................. 505,542,096 621,180,725
VI. Currency swaps1 ......................................................................................................... 594,394,058 565,474,647
VII. Interest rate swaps, currency options and interest rate futures1 ............................. 2,919,036,799 2,855,937,706
VIII. Other items for which the Bank is contingently liable .............................................. 39,596,011 38,125,663
TOTAL CONTINGENT LIABILITIES ................................................................................... 7,814,304,451 7,899,893,146
1. Represents notional amount.
(` in ‘000s)
forming part of the Balance Sheet (Contd.)
schedules