ICICI Bank 2014 Annual Report Download - page 66
Download and view the complete annual report
Please find page 66 of the 2014 ICICI Bank annual report below. You can navigate through the pages in the report by either clicking on the pages listed below, or by using the keyword search tool below to find specific information within the annual report.-
 1
1 -
2
-
3
-
4
-
5
-
6
-
7
-
8
-
9
-
10
-
11
-
12
-
13
-
14
-
15
-
16
-
17
-
18
-
19
-
20
-
21
-
22
-
23
-
24
-
25
-
26
-
27
-
28
-
29
-
30
-
31
-
32
-
33
-
34
-
35
-
36
-
37
-
38
-
39
-
40
-
41
-
42
-
43
-
44
-
45
-
46
-
47
-
48
-
49
-
50
-
51
-
52
-
53
-
54
-
55
-
 56
56 -
 57
57 -
 58
58 -
 59
59 -
 60
60 -
 61
61 -
 62
62 -
 63
63 -
 64
64 -
 65
65 -
 66
66 -
 67
67 -
 68
68 -
 69
69 -
 70
70 -
 71
71 -
 72
72 -
 73
73 -
 74
74 -
 75
75 -
 76
76 -
77
-
78
-
79
-
80
-
81
-
82
-
83
-
84
-
85
-
86
-
87
-
88
-
89
-
90
-
91
-
92
-
93
-
94
-
95
-
96
-
97
-
98
-
99
-
100
-
101
-
102
-
103
-
104
-
105
-
106
-
107
-
108
-
109
-
110
-
111
-
112
-
113
-
114
-
115
-
116
-
117
-
118
-
119
-
120
-
121
-
122
-
123
-
124
-
125
-
126
-
127
-
128
-
129
-
130
-
131
-
132
-
133
-
134
-
135
-
136
-
137
-
138
-
139
-
140
-
141
-
142
-
143
-
144
-
145
-
146
-
147
-
148
-
149
-
150
-
151
-
152
-
153
-
154
-
155
-
156
-
157
-
158
-
159
-
160
-
161
-
162
-
163
-
164
-
165
-
166
-
167
-
168
-
169
-
170
-
171
-
172
-
173
-
174
-
175
-
176
-
177
-
178
-
179
-
180
-
181
-
182
-
183
-
184
-
185
-
186
-
187
-
188
-
189
-
190
-
191
-
192
-
193
-
194
-
195
-
196
 |
 |
Management’s Discussion & Analysis
64
STANDALONE FINANCIALS AS PER INDIAN GAAP
Summary
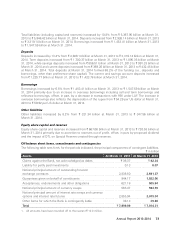
During fiscal 2014, the Bank focused on balancing growth, profitability and risk management.
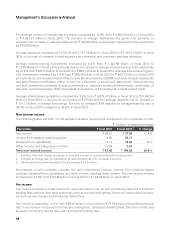
Profit after tax increased by 17.8% from ` 83.25 billion in fiscal 2013 to ` 98.10 billion in fiscal 2014.
The increase in profit after tax was mainly due to an 18.8% increase in net interest income and a 24.9%
increase in non-interest income offset, in part, by a 14.4% increase in non-interest expenses and a 45.6%
increase in provisions and contingencies (excluding provisions for tax). Net interest income increased by
18.8% from ` 138.66 billion in fiscal 2013 to ` 164.75 billion in fiscal 2014, reflecting an increase of 22
basis points in net interest margin and an increase of 10.9% in average interest-earning assets.
Non-interest income increased by 24.9% from ` 83.46 billion in fiscal 2013 to ` 104.28 billion in fiscal
2014. The increase in non-interest income was primarily due to a gain of ` 10.17 billion from treasury-
related activities in fiscal 2014 compared to a gain of ` 4.95 billion in fiscal 2014 and an increase in
dividend income from subsidiaries from ` 9.12 billion in fiscal 2013 to ` 12.96 billion in fiscal 2014. Fee
income increased by 12.4% from ` 69.01 billion in fiscal 2013 to ` 77.58 billion in fiscal 2014.
Non-interest expenses increased by 14.4% from ` 90.13 billion in fiscal 2013 to ` 103.09 billion in
fiscal 2014 primarily due to an increase in other administrative expenses. Provisions and contingencies
(excluding provisions for tax) increased by 45.6% from ` 18.03 billion in fiscal 2013 to ` 26.26 billion in
fiscal 2014. The increase in provisions and contingencies (excluding provisions for tax) was primarily due
to increase in additions to non-performing assets (NPAs) and restructured loans in the small & medium
enterprises (SME) and corporate portfolio, resulting in a higher provision requirement.
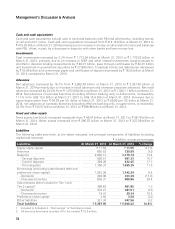
Total assets increased by 10.8% from ` 5,367.95 billion at March 31, 2013 to ` 5,946.42 billion at March
31, 2014. Total deposits increased by 13.4% from ` 2,926.14 billion at March 31, 2013 to ` 3,319.14 billion
at March 31, 2014. Savings account deposits increased by 15.7% from ` 856.51 billion at March 31, 2013
to ` 991.33 billion at March 31, 2014. Current account deposits increased by 17.1% from ` 369.26 billion at
March 31, 2013 to ` 432.45 billion at March 31, 2014. Term deposits increased by 11.5% from ` 1,700.37
billion at March 31, 2013 to ` 1,895.35 billion at March 31, 2014. The current and savings account (CASA)
ratio was 42.9% at March 31, 2014 compared to 41.9% at March 31, 2013. Total advances increased by
16.7% from ` 2,902.49 billion at March 31, 2013 to ` 3,387.03 billion at March 31, 2014 primarily due to
an increase in retail advances and overseas corporate advances (including the impact of exchange rate
depreciation). The net NPA ratio increased from 0.64% at March 31, 2013 to 0.82% at March 31, 2014.
The Bank continued to expand its branch network in India. Branch network of the Bank in India increased
from 3,100 branches and extension counters at March 31, 2013 to 3,753 branches and extension counters
at March 31, 2014. ATM network of the Bank increased from 10,481 ATMs at March 31, 2013 to 11,315
ATMs at March 31, 2014.
The Bank is subject to the Basel III capital adequacy guidelines stipulated by RBI with effect from April 1,
2013. The total capital adequacy ratio of the Bank at March 31, 2014 in accordance with RBI guidelines
on Basel III was 17.70% with a Tier-1 capital adequacy ratio of 12.78%.
Till March 31, 2013, the Bank was subject to the Basel II capital adequacy guidelines. The total capital
adequacy ratio of the Bank in accordance with RBI guidelines on Basel II was 19.08% at March 31, 2014
compared to 18.74% at March 31, 2013.
Management’s Discussion & Analysis