ICICI Bank 2014 Annual Report Download - page 61
Download and view the complete annual report
Please find page 61 of the 2014 ICICI Bank annual report below. You can navigate through the pages in the report by either clicking on the pages listed below, or by using the keyword search tool below to find specific information within the annual report.
Annual Report 2013-2014 59
Inflation, measured by the Wholesale Price Index (WPI), increased from 4.8% in April 2013 to 7.5% in
November 2013, and then eased to 5.7% in March 2014. Average WPI inflation during fiscal 2014 was
5.9%, compared to 7.4% average inflation during fiscal 2013. Inflation eased due to a moderation in the
manufactured products segment, where average inflation in fiscal 2014 decreased to 2.9% compared
to 5.4% in fiscal 2013. Fuel inflation remained flat at about 10.0% in fiscal 2014. However, food inflation
increased from an average of 9.9% in fiscal 2013 to 12.8% in fiscal 2014. Retail inflation, measured by the
Consumer Price Index (CPI), remained elevated at above 9.0% levels during the early part of fiscal 2014
and increased to a high of 11.2% in November 2013 before easing to 8.3% in March 2014. CPI inflation
largely followed the trend in food inflation. Core CPI inflation, excluding food and fuel, remained steady
at around 8.0% through fiscal 2014.
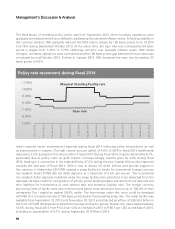
Conduct of monetary policy during fiscal 2014 could be demarcated into three distinct phases. In the
early part of fiscal 2014, considering the easing inflation levels, Reserve Bank of India (RBI) reduced the
repo rate by 25 basis points from 7.50% to 7.25% in May 2013. In the second phase, following the US
Federal Reserve indicating a likely withdrawal of its quantitative easing programme in May 2013, there
was a considerable outflow of portfolio funds from emerging market economies. India saw a significant
outflow of foreign portfolio investments, particularly debt funds, leading to a sharp depreciation in the
rupee. The rupee depreciated by 17.8% against the US dollar between June-August 2013 and touched a
low of ` 68.4 per US dollar on August 28, 2013 as compared to ` 56.5 per US dollar at end-May 2013. In
response to these developments, RBI changed its monetary policy stance. On July 15, 2013, with a view
to stabilise the exchange rate, RBI increased the Marginal Standing Facility (MSF) rate, which is the rate at
which banks borrow funds, in excess of the specified threshold, overnight from RBI against government
securities, by 200 basis points from 8.25% to 10.25% while keeping the repo rate unchanged. The RBI
also fixed the borrowing limit for banks under the Liquidity Adjustment Facility (LAF) at ` 750.00 billion.
Effective July 24, 2013, RBI announced a further reduction in the borrowing limit under LAF to 0.5%
of net demand and time liabilities. In addition, effective July 27, 2013, the minimum daily cash reserve
ratio balance required to be maintained by banks was increased to 99.0% of the stipulated fortnightly
requirement from 70.0% earlier. The immediate impact of these measures on the market was a sharp
increase in wholesale deposit rates and yields on government securities. Considering the impact of these
measures to stabilise the exchange rate, RBI allowed certain adjustments on the investment portfolio
of banks. The measures included increasing the limit for holding government securities in the held-to-
maturity (HTM) category to 24.5% of net demand and time liabilities as against the earlier requirement
of 24.0%, allowing banks to transfer securities from the available-for-sale and held-for-trading categories
to the held-to-maturity category up to 24.5% of demand and time liabilities as a one-time measure at
prices prevailing prior to the announcement of the July 15, 2013 measures, and giving banks the option
to amortise net depreciation on the available-for-sale and held-for-trading portfolio over the remaining
period of fiscal 2014.


