ICICI Bank 2014 Annual Report Download - page 62
Download and view the complete annual report
Please find page 62 of the 2014 ICICI Bank annual report below. You can navigate through the pages in the report by either clicking on the pages listed below, or by using the keyword search tool below to find specific information within the annual report.-
 1
1 -
2
-
3
-
4
-
5
-
6
-
7
-
8
-
9
-
10
-
11
-
12
-
13
-
14
-
15
-
16
-
17
-
18
-
19
-
20
-
21
-
22
-
23
-
24
-
25
-
26
-
27
-
28
-
29
-
30
-
31
-
32
-
33
-
34
-
35
-
36
-
37
-
38
-
39
-
40
-
41
-
42
-
43
-
44
-
45
-
46
-
47
-
48
-
49
-
50
-
51
-
 52
52 -
 53
53 -
 54
54 -
 55
55 -
 56
56 -
 57
57 -
 58
58 -
 59
59 -
 60
60 -
 61
61 -
 62
62 -
 63
63 -
 64
64 -
 65
65 -
 66
66 -
 67
67 -
 68
68 -
 69
69 -
 70
70 -
 71
71 -
 72
72 -
73
-
74
-
75
-
76
-
77
-
78
-
79
-
80
-
81
-
82
-
83
-
84
-
85
-
86
-
87
-
88
-
89
-
90
-
91
-
92
-
93
-
94
-
95
-
96
-
97
-
98
-
99
-
100
-
101
-
102
-
103
-
104
-
105
-
106
-
107
-
108
-
109
-
110
-
111
-
112
-
113
-
114
-
115
-
116
-
117
-
118
-
119
-
120
-
121
-
122
-
123
-
124
-
125
-
126
-
127
-
128
-
129
-
130
-
131
-
132
-
133
-
134
-
135
-
136
-
137
-
138
-
139
-
140
-
141
-
142
-
143
-
144
-
145
-
146
-
147
-
148
-
149
-
150
-
151
-
152
-
153
-
154
-
155
-
156
-
157
-
158
-
159
-
160
-
161
-
162
-
163
-
164
-
165
-
166
-
167
-
168
-
169
-
170
-
171
-
172
-
173
-
174
-
175
-
176
-
177
-
178
-
179
-
180
-
181
-
182
-
183
-
184
-
185
-
186
-
187
-
188
-
189
-
190
-
191
-
192
-
193
-
194
-
195
-
196
 |
 |
Management’s Discussion & Analysis
60
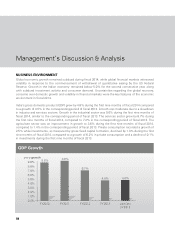
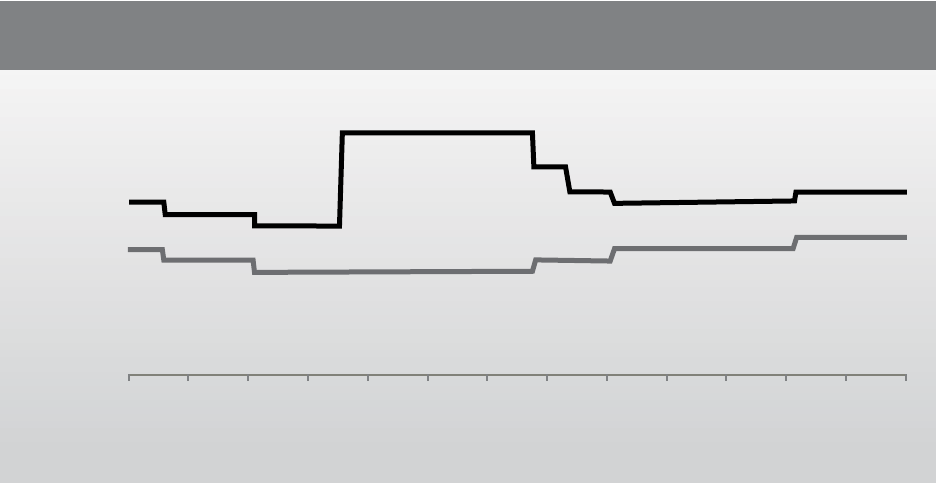
The third phase of monetary policy action was from September 2013 when monetary operations were
gradually normalised while focus shifted to addressing the elevated inflation levels. Following stability in
the currency markets, RBI gradually reduced the MSF rate in stages by 150 basis points from 10.25%
to 8.75% during September-October 2013. At the same time, the repo rate was increased by 50 basis
points in stages from 7.25% to 7.75% reflecting concerns over elevated inflation levels. With these
changes, monetary operations were normalised and the 100 basis points gap between the two rates was
re-instated by end-October 2013. Further, in January 2014, RBI increased the repo rate by another 25
basis points to 8.0%.
India’s external sector environment improved during fiscal 2014 following policy interventions as well
as improvement in exports. The high current account deficit of 4.8% of GDP in fiscal 2013 significantly
reduced to 2.2% during the first nine months of fiscal 2014. During fiscal 2014, imports declined by 8.1%,
particularly due to policy curbs on gold imports. Correspondingly, exports grew by 4.0% during fiscal
2014, leading to a contraction in the trade deficit by 27.2% during the year. Capital inflows also improved
towards the later part of fiscal 2014. With a view to attract US dollar inflows and provide support to
the currency, in September 2013 RBI opened a swap facility for banks for incremental foreign currency
non-resident (bank) (FCNR (B)) US dollar deposits at a fixed rate of 3.5% per annum. The incremental
non-resident dollar deposits mobilised under the swap facility were permitted to be deducted from the
adjusted net bank credit for computation of priority sector lending targets and also from net demand and
time liabilities for maintenance of cash reserve ratio and statutory liquidity ratio. The foreign currency
borrowing limits of banks were also enhanced and banks were allowed to borrow up to 100.0% of their
unimpaired Tier I capital as against 50.0% earlier. The borrowings under this route could be swapped
with RBI at a concessional rate of 100 basis points below the prevailing swap rate. The swap facility was
available from September 10, 2013 until November 30, 2013 and attracted an inflow of US$ 34.3 billion in
the form of FCNR (B) deposits and bank borrowings during the period. Overall, the rupee depreciated by
10.5% during fiscal 2014 from ` 54.4 per US$ at end-March 2013 to ` 60.1 per US$ at end-March 2014,
including an appreciation of 9.7% during September 2013-March 2014.
Management’s Discussion & Analysis
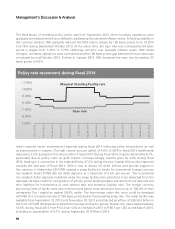
Policy rate movement during fiscal 2014
11.00%
10.00%
9. 00%
8. 00%
7. 00%
6. 00%
5 00%
Marginal Standing Facility rate
Repo rate
Mar 1, 2013
Mar 31, 2013
Apr 30, 2013
Jul 29, 2013
Aug 28, 2013
Sep 27, 2013
Oct 27, 2013
Nov 26, 2013
Dec 26, 2013
Jan 25, 2014
Feb 24, 2014
Mar 31, 2014
Jun 29, 2013
May 30, 2013