ICICI Bank 2014 Annual Report Download - page 109
Download and view the complete annual report
Please find page 109 of the 2014 ICICI Bank annual report below. You can navigate through the pages in the report by either clicking on the pages listed below, or by using the keyword search tool below to find specific information within the annual report.-
 1
1 -
2
-
3
-
4
-
5
-
6
-
7
-
8
-
9
-
10
-
11
-
12
-
13
-
14
-
15
-
16
-
17
-
18
-
19
-
20
-
21
-
22
-
23
-
24
-
25
-
26
-
27
-
28
-
29
-
30
-
31
-
32
-
33
-
34
-
35
-
36
-
37
-
38
-
39
-
40
-
41
-
42
-
43
-
44
-
45
-
46
-
47
-
48
-
49
-
50
-
51
-
52
-
53
-
54
-
55
-
56
-
57
-
58
-
59
-
60
-
61
-
62
-
63
-
64
-
65
-
66
-
67
-
68
-
69
-
70
-
71
-
72
-
73
-
74
-
75
-
76
-
77
-
78
-
79
-
80
-
81
-
82
-
83
-
84
-
85
-
86
-
87
-
88
-
89
-
90
-
91
-
92
-
93
-
94
-
95
-
96
-
97
-
98
-
 99
99 -
 100
100 -
 101
101 -
 102
102 -
 103
103 -
 104
104 -
 105
105 -
 106
106 -
 107
107 -
 108
108 -
 109
109 -
 110
110 -
 111
111 -
 112
112 -
 113
113 -
 114
114 -
 115
115 -
 116
116 -
 117
117 -
 118
118 -
 119
119 -
120
-
121
-
122
-
123
-
124
-
125
-
126
-
127
-
128
-
129
-
130
-
131
-
132
-
133
-
134
-
135
-
136
-
137
-
138
-
139
-
140
-
141
-
142
-
143
-
144
-
145
-
146
-
147
-
148
-
149
-
150
-
151
-
152
-
153
-
154
-
155
-
156
-
157
-
158
-
159
-
160
-
161
-
162
-
163
-
164
-
165
-
166
-
167
-
168
-
169
-
170
-
171
-
172
-
173
-
174
-
175
-
176
-
177
-
178
-
179
-
180
-
181
-
182
-
183
-
184
-
185
-
186
-
187
-
188
-
189
-
190
-
191
-
192
-
193
-
194
-
195
-
196
 |
 |

F21
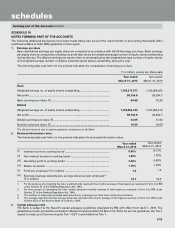
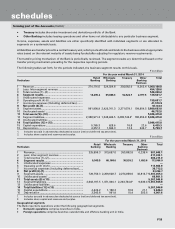
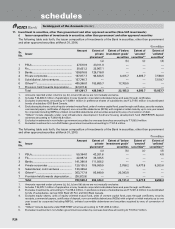
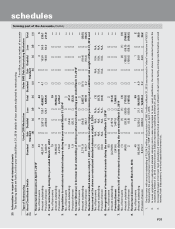
The following table sets forth the maturity pattern of assets and liabilities of the Bank at March 31, 2013.
` in million
Maturity buckets
Loans &
Advances1
Investment
securities1
Deposits1Borrowings1,2 Total foreign
currency
assets
Total foreign
currency
liabilities
Day 1 .................................................. 9,112.9 48,665.0 27,643.7 — 31,676.4 6,857.7
2 to 7 days ......................................... 17,209.7 216,271.1 88,557.0 156,492.0 57,443.0 24,006.9
8 to 14 days ....................................... 14,952.5 66,915.8 64,225.5 31,737.6 41,757.7 55,617.7
15 to 28 days ..................................... 56,985.4 117,812.7 78,776.1 8,271.2 29,492.2 25,583.6
29 days to 3 months .......................... 185,648.6 98,700.0 303,018.0 84,903.6 84,484.9 107,712.0
3 to 6 months ..................................... 204,592.9 77,242.1 265,480.7 126,686.4 71,474.5 151,527.4
6 months to 1 year ............................ 319,463.0 158,405.5 459,085.7 158,589.4 59,533.2 199,375.4
1 to 3 years ........................................ 1,185,745.7 241,872.3 442,488.6 208,659.0 206,040.3 212,432.6
3 to 5 years ........................................ 493,899.9 212,552.0 600,623.9 232,053.6 194,085.6 163,472.9
Above 5 years .................................... 414,883.8 475,499.5 596,237.1 446,022.1 249,487.3 189,654.3
Total ................................................... 2,902,494.4 1,713,936.0 2,926,136.3 1,453,414.9 1,025,475.1 1,136,240.5
1. Includes foreign currency balances.
2. Includes borrowings in the nature of subordinated debts and preference shares.
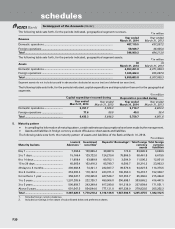
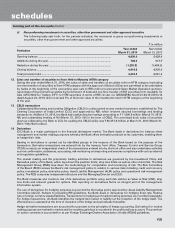
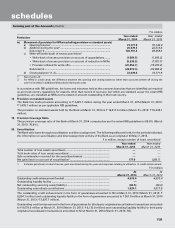
6. Preference shares
Certain government securities amounting to ` 2,970.9 million at March 31, 2014 (March 31, 2013: ` 2,749.9 million) have
been earmarked against redemption of preference shares issued by the Bank, which fall due for redemption on April 20,
2018, as per the original issue terms.
7. Employee Stock Option Scheme (ESOS)
In terms of the ESOS, as amended, the maximum number of options granted to any eligible employee in a financial
year shall not exceed 0.05% of the issued equity shares of the Bank at the time of grant of the options and aggregate of
all such options granted to the eligible employees shall not exceed 10% of the aggregate number of the issued equity
shares of the Bank on the date(s) of the grant of options. Under the stock option scheme, eligible employees are entitled
to apply for equity shares. Options granted till March 31, 2004 vested in a graded manner over a three-year period, with
20%, 30% and 50% of the grants vesting in each year commencing from the end of 12 months from the date of grant.
Options granted after April 1, 2004 vest in a graded manner over a four-year period, with 20%, 20%, 30% and 30% of the
grants vesting in each year commencing from the end of 12 months from the date of grant. Options granted in April 2009
vest in a graded manner over a five year period with 20%, 20%, 30% and 30% of grant vesting each year, commencing
from the end of 24 months from the date of grant. Options granted in September, 2011 vest in a graded manner over a
five years period with 15%, 20%, 20% and 45% of grant vesting each year, commencing from the end of 24 months from
the date of the grant. The options can be exercised within 10 years from the date of grant or five years from the date of
vesting, whichever is later. The exercise price of Bank’s options was the last closing price on the stock exchange, which
recorded highest trading volume preceding the date of grant of options. Hence, there was no compensation cost based
on intrinsic value of options.
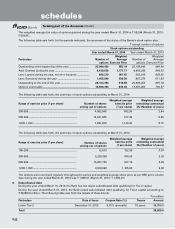
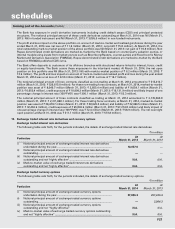
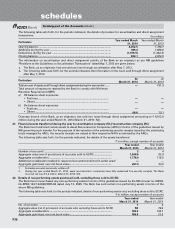
In February, 2011, the Bank granted 3,035,000 options to eligible employees and whole-time Directors of ICICI Bank and
certain of its subsidiaries at an exercise price of ` 967. Of these options granted, 50% would vest on April 30, 2014 and
the balance 50% would vest on April 30, 2015. The options can be exercised within 10 years from the date of grant or
five years from the date of vesting, whichever is later. Based on intrinsic value of options, compensation cost of ` 20.9
million was recognised during the year ended March 31, 2014 (March 31, 2013: ` 21.0 million).
If ICICI Bank had used the fair value of options based on binomial tree model, compensation cost in the year ended
March 31, 2014 would have been higher by ` 2,359.8 million and proforma profit after tax would have been ` 95.74
billion. On a proforma basis, ICICI Bank’s basic and diluted earnings per share would have been ` 82.95 and ` 82.62
respectively. The key assumptions used to estimate the fair value of options granted during the year ended March 31,
2014 are given below.
Risk-free interest rate .................................................................................................................. 7.60% to 9.12%
Expected life ................................................................................................................................ 6.35 years
Expected volatility ....................................................................................................................... 48.70% to 48.96%
Expected dividend yield .............................................................................................................. 1.70% to 1.96%
forming part of the Accounts (Contd.)
schedules