ICICI Bank 2014 Annual Report Download - page 69
Download and view the complete annual report
Please find page 69 of the 2014 ICICI Bank annual report below. You can navigate through the pages in the report by either clicking on the pages listed below, or by using the keyword search tool below to find specific information within the annual report.-
 1
1 -
2
-
3
-
4
-
5
-
6
-
7
-
8
-
9
-
10
-
11
-
12
-
13
-
14
-
15
-
16
-
17
-
18
-
19
-
20
-
21
-
22
-
23
-
24
-
25
-
26
-
27
-
28
-
29
-
30
-
31
-
32
-
33
-
34
-
35
-
36
-
37
-
38
-
39
-
40
-
41
-
42
-
43
-
44
-
45
-
46
-
47
-
48
-
49
-
50
-
51
-
52
-
53
-
54
-
55
-
56
-
57
-
58
-
 59
59 -
 60
60 -
 61
61 -
 62
62 -
 63
63 -
 64
64 -
 65
65 -
 66
66 -
 67
67 -
 68
68 -
 69
69 -
 70
70 -
 71
71 -
 72
72 -
 73
73 -
 74
74 -
 75
75 -
 76
76 -
 77
77 -
 78
78 -
 79
79 -
80
-
81
-
82
-
83
-
84
-
85
-
86
-
87
-
88
-
89
-
90
-
91
-
92
-
93
-
94
-
95
-
96
-
97
-
98
-
99
-
100
-
101
-
102
-
103
-
104
-
105
-
106
-
107
-
108
-
109
-
110
-
111
-
112
-
113
-
114
-
115
-
116
-
117
-
118
-
119
-
120
-
121
-
122
-
123
-
124
-
125
-
126
-
127
-
128
-
129
-
130
-
131
-
132
-
133
-
134
-
135
-
136
-
137
-
138
-
139
-
140
-
141
-
142
-
143
-
144
-
145
-
146
-
147
-
148
-
149
-
150
-
151
-
152
-
153
-
154
-
155
-
156
-
157
-
158
-
159
-
160
-
161
-
162
-
163
-
164
-
165
-
166
-
167
-
168
-
169
-
170
-
171
-
172
-
173
-
174
-
175
-
176
-
177
-
178
-
179
-
180
-
181
-
182
-
183
-
184
-
185
-
186
-
187
-
188
-
189
-
190
-
191
-
192
-
193
-
194
-
195
-
196
 |
 |

Annual Report 2013-2014 67
The yield on average interest-earning assets decreased by 5 basis points from 8.97% in fiscal 2013 to
8.92% in fiscal 2014 primarily due to a reduction of 25 basis points in yield on average interest-earning
investments and lower interest on income tax refund, offset, in part, by an increase of 6 basis points in
the yield on advances:
• Yield on average interest-earning investments decreased from 7.73% in fiscal 2013 to 7.48% in fiscal
2014 primarily on account of decrease in yield on non-SLR investments. The yield on average interest-
earning non-SLR investments decreased from 7.62% in fiscal 2013 to 6.89% in fiscal 2014 primarily
due to decrease in yield on pass through certificates, maturity of high yielding bonds and debentures
and increase in investment in lower yielding Rural Infrastructure Development Fund (RIDF) and other
related investments. The yield on SLR investments increased marginally from 7.80% in fiscal 2013 to
7.83% in fiscal 2014.
• Interest on income tax refund was lower at ` 1.82 billion in fiscal 2014 compared to ` 2.58 billion
in fiscal 2013. The receipt, amount and timing of such income depend on the nature and timing of
determinations by tax authorities and are neither consistent nor predictable.
However, the above decrease was offset, in part, by an increase in yield on average advances from 9.94%
in fiscal 2013 to 10.00% in fiscal 2014. The Base Rate of the Bank increased from 9.75% to 10.00% with
effect from August 23, 2013.
The cost of funds decreased by 22 basis points from 6.43% in fiscal 2013 to 6.21% in fiscal 2014 primarily
due to the following:
• Decrease in cost of average deposits by 27 basis points from 6.38% in FY2013 to 6.11% in FY2014
primarily due to a decrease in cost of average term deposits and an increase in average CASA deposits.
The cost of average term deposits decreased by 32 basis points from 8.47% in FY2013 to 8.15% in
FY2014. The cost of average term deposits was lower primarily due to benefit on account of re-pricing
of term deposits at lower rates in the beginning of fiscal 2014. This was offset, in part, by the impact
of higher cost term deposits mobilised during the three months ended September 30, 2013 (Q2-2014)
due to higher systemic interest rates during Q2-2014. The average CASA ratio increased from 38.0%
in fiscal 2013 to 39.4% in fiscal 2014.
• Decrease in cost of borrowings by 15 basis points from 6.54% in FY2013 to 6.39% in FY2014 primarily
due to decrease in cost of call and term borrowings, refinance borrowings and bond borrowings
including capital instrument borrowings.
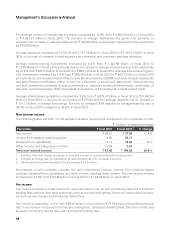
The following table sets forth, for the period indicated, the trend in average interest-earning assets and
average interest-bearing liabilities:
` in billion, except percentages
Fiscal 2013 Fiscal 2014 % change
Advances ` 2,751.19 ` 3,144.21 14.3%
Interest-earning investments 1,424.90 1,544.96 8.4
Other interest-earning assets 289.31 252.40 (9.3)
Total interest-earning assets 4,465.40 4,951.57 10.9
Deposits 2,648.48 2,922.42 10.3
Borrowings11,424.99 1,540.12 8.1
Total interest-bearing liabilities ` 4,073.47 ` 4,462.54 9.6%
1. Borrowings exclude preference share capital.
2. Average investments and average borrowings include average short-term re-purchase transactions.
3. Average balances are the averages of daily balances, except averages of foreign branches which are calculated
on a fortnightly basis.
4. All amounts have been rounded off to the nearest ` 10.0 million.