ICICI Bank 2014 Annual Report Download - page 110
Download and view the complete annual report
Please find page 110 of the 2014 ICICI Bank annual report below. You can navigate through the pages in the report by either clicking on the pages listed below, or by using the keyword search tool below to find specific information within the annual report.-
 1
1 -
2
-
3
-
4
-
5
-
6
-
7
-
8
-
9
-
10
-
11
-
12
-
13
-
14
-
15
-
16
-
17
-
18
-
19
-
20
-
21
-
22
-
23
-
24
-
25
-
26
-
27
-
28
-
29
-
30
-
31
-
32
-
33
-
34
-
35
-
36
-
37
-
38
-
39
-
40
-
41
-
42
-
43
-
44
-
45
-
46
-
47
-
48
-
49
-
50
-
51
-
52
-
53
-
54
-
55
-
56
-
57
-
58
-
59
-
60
-
61
-
62
-
63
-
64
-
65
-
66
-
67
-
68
-
69
-
70
-
71
-
72
-
73
-
74
-
75
-
76
-
77
-
78
-
79
-
80
-
81
-
82
-
83
-
84
-
85
-
86
-
87
-
88
-
89
-
90
-
91
-
92
-
93
-
94
-
95
-
96
-
97
-
98
-
99
-
 100
100 -
 101
101 -
 102
102 -
 103
103 -
 104
104 -
 105
105 -
 106
106 -
 107
107 -
 108
108 -
 109
109 -
 110
110 -
 111
111 -
 112
112 -
 113
113 -
 114
114 -
 115
115 -
 116
116 -
 117
117 -
 118
118 -
 119
119 -
 120
120 -
121
-
122
-
123
-
124
-
125
-
126
-
127
-
128
-
129
-
130
-
131
-
132
-
133
-
134
-
135
-
136
-
137
-
138
-
139
-
140
-
141
-
142
-
143
-
144
-
145
-
146
-
147
-
148
-
149
-
150
-
151
-
152
-
153
-
154
-
155
-
156
-
157
-
158
-
159
-
160
-
161
-
162
-
163
-
164
-
165
-
166
-
167
-
168
-
169
-
170
-
171
-
172
-
173
-
174
-
175
-
176
-
177
-
178
-
179
-
180
-
181
-
182
-
183
-
184
-
185
-
186
-
187
-
188
-
189
-
190
-
191
-
192
-
193
-
194
-
195
-
196
 |
 |

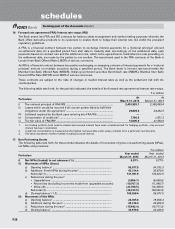
F22
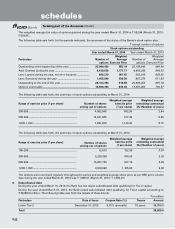
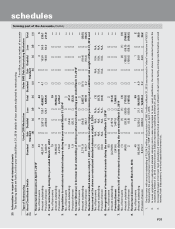
The weighted average fair value of options granted during the year ended March 31, 2014 is ` 592.94 (March 31, 2013:
` 434.91).
The following table sets forth, for the periods indicated, the summary of the status of the Banks’s stock option plan.
` except number of options
Stock options outstanding
Year ended March 31, 2014 Year ended March 31, 2013
Particulars
Number of
options
Weighted
Average
Exercise Price
Number of
options
Weighted
Average
Exercise Price
Outstanding at the beginning of the year ........................... 25,980,453 855.18 23,199,545 846.94
Add: Granted during the year ............................................... 4,419,650 1,177.17 4,450,200 844.53
Less: Lapsed during the year, net of re-issuance ................. 890,210 961.65 802,019 929.35
Less: Exercised during the year ............................................ 1,405,540 530.56 867,273 511.63
Outstanding at the end of the year ....................................... 28,104,353 918.68 25,980,453 855.18
Options exercisable ............................................................... 14,608,343 833.48 13,597,383 793.57
The following table sets forth, the summary of stock options outstanding at March 31, 2014.
Range of exercise price (` per share)
Number of shares
arising out of options
Weighted average
exercise price
(` per share)
Weighted average
remaining contractual
life (Number of years)
300-599 .................................................................. 4,082,048 482.39 2.44
600-999 .................................................................. 16,041,045 917.49 5.66
1,000-1,399 ............................................................ 7,981,260 1,144.22 8.15
The following table sets forth, the summary of stock options outstanding at March 31, 2013.
Range of exercise price (` per share) Number of shares
arising out of options
Weighted average
exercise price
(` per share)
Weighted average
remaining contractual
life (Number of years)
105-299 ................................................................. 12,675 132.05 0.07
300-599 ................................................................. 5,229,338 470.26 3.35
600-999 ................................................................. 16,827,750 917.10 6.66
1,000-1,399 ........................................................... 3,910,690 1,105.80 8.06
The options were exercised regularly throughout the period and weighted average share price as per NSE price volume
data during the year ended March 31, 2014 was ` 1,046.61 (March 31, 2013: ` 1,000.21)
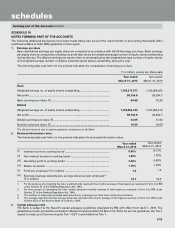
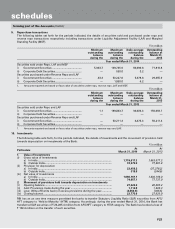
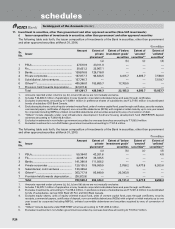
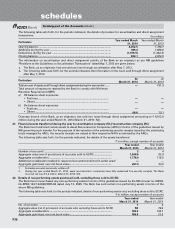
8. Subordinated debt
During the year ended March 31, 2014, the Bank has not raised subordinated debt qualifying for Tier-2 capital.
During the year ended March 31, 2013, the Bank raised subordinated debt qualifying for Tier-2 capital amounting to
` 38,000.0 million. The following table sets forth the details of these bonds.
` in million
Particulars Date of Issue Coupon Rate (%) Tenure Amount
Lower Tier-2 December 31, 2012 9.15% (annually) 10 years 38,000.0
Total 38,000.0
forming part of the Accounts (Contd.)
schedules