ICICI Bank 2014 Annual Report Download - page 68
Download and view the complete annual report
Please find page 68 of the 2014 ICICI Bank annual report below. You can navigate through the pages in the report by either clicking on the pages listed below, or by using the keyword search tool below to find specific information within the annual report.-
 1
1 -
2
-
3
-
4
-
5
-
6
-
7
-
8
-
9
-
10
-
11
-
12
-
13
-
14
-
15
-
16
-
17
-
18
-
19
-
20
-
21
-
22
-
23
-
24
-
25
-
26
-
27
-
28
-
29
-
30
-
31
-
32
-
33
-
34
-
35
-
36
-
37
-
38
-
39
-
40
-
41
-
42
-
43
-
44
-
45
-
46
-
47
-
48
-
49
-
50
-
51
-
52
-
53
-
54
-
55
-
56
-
57
-
 58
58 -
 59
59 -
 60
60 -
 61
61 -
 62
62 -
 63
63 -
 64
64 -
 65
65 -
 66
66 -
 67
67 -
 68
68 -
 69
69 -
 70
70 -
 71
71 -
 72
72 -
 73
73 -
 74
74 -
 75
75 -
 76
76 -
 77
77 -
 78
78 -
79
-
80
-
81
-
82
-
83
-
84
-
85
-
86
-
87
-
88
-
89
-
90
-
91
-
92
-
93
-
94
-
95
-
96
-
97
-
98
-
99
-
100
-
101
-
102
-
103
-
104
-
105
-
106
-
107
-
108
-
109
-
110
-
111
-
112
-
113
-
114
-
115
-
116
-
117
-
118
-
119
-
120
-
121
-
122
-
123
-
124
-
125
-
126
-
127
-
128
-
129
-
130
-
131
-
132
-
133
-
134
-
135
-
136
-
137
-
138
-
139
-
140
-
141
-
142
-
143
-
144
-
145
-
146
-
147
-
148
-
149
-
150
-
151
-
152
-
153
-
154
-
155
-
156
-
157
-
158
-
159
-
160
-
161
-
162
-
163
-
164
-
165
-
166
-
167
-
168
-
169
-
170
-
171
-
172
-
173
-
174
-
175
-
176
-
177
-
178
-
179
-
180
-
181
-
182
-
183
-
184
-
185
-
186
-
187
-
188
-
189
-
190
-
191
-
192
-
193
-
194
-
195
-
196
 |
 |

Management’s Discussion & Analysis
66
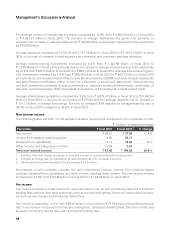
Net interest income and spread analysis
The following table sets forth, for the periods indicated, the net interest income and spread analysis.
` in billion, except percentages
Fiscal 2013 Fiscal 2014 % change
Interest income ` 400.75 ` 441.78 10.2%
Interest expense 262.09 277.03 5.7
Net interest income 138.66 164.75 18.8
Average interest-earning assets14,465.40 4,951.57 10.9
Average interest-bearing liabilities1` 4,073.47 ` 4,462.54 9.6%
Net interest margin 3.11% 3.33% —
Average yield 8.97% 8.92% —
Average cost of funds 6.43% 6.21% —
Interest spread 2.54% 2.71% —
1. The average balances are the averages of daily balances, except averages of foreign branches which are
calculated on a fortnightly basis.
2. All amounts have been rounded off to the nearest ` 10.0 million.
Net interest income increased by 18.8% from ` 138.66 billion in fiscal 2013 to ` 164.75 billion in fiscal
2014 reflecting an increase in net interest margin from 3.11% in fiscal 2013 to 3.33% in fiscal 2014 and a
10.9% increase in the average volume of interest-earning assets.
The yield on interest-earning assets decreased from 8.97% in fiscal 2013 to 8.92% in fiscal 2014 offset,
in part, by a decrease in the cost of funds from 6.43% in fiscal 2013 to 6.21% in fiscal 2014. The interest
spread increased from 2.54% in fiscal 2013 to 2.71% in fiscal 2014. Net interest margin increased from
3.11% in fiscal 2013 to 3.33% in fiscal 2014.
Net interest margin of domestic operations increased from 3.51% for fiscal 2013 to 3.68% for fiscal 2014
primarily due to increase in yield on advances and decrease in cost of deposits and borrowings, offset, in
part, by a decrease in yield on investments.
Net interest margin of overseas branches increased from 1.34% for fiscal 2013 to 1.71% for fiscal
2014 primarily on account of decrease in cost of term deposits and borrowings and increase in yield on
advances.
The following table sets forth, for the periods indicated, the trend in yield, cost, spread and margin.
Fiscal 2013 Fiscal 2014
Yield on interest-earning assets 8.97% 8.92%
- On advances 9.94 10.00
- On investments 7.73 7.48
- On SLR investments 7.80 7.83
- On other investments 7.62 6.89
- On other interest-earning assets 5.96 4.55
Cost of interest-bearing liabilities 6.43 6.21
- Cost of deposits 6.38 6.11
- Current and savings account (CASA) deposits 2.97 2.99
- Term deposits 8.47 8.15
- Cost of borrowings 6.54 6.39
Interest spread 2.54 2.71
Net interest margin 3.11% 3.33%
Management’s Discussion & Analysis