ICICI Bank 2014 Annual Report Download - page 71
Download and view the complete annual report
Please find page 71 of the 2014 ICICI Bank annual report below. You can navigate through the pages in the report by either clicking on the pages listed below, or by using the keyword search tool below to find specific information within the annual report.-
 1
1 -
2
-
3
-
4
-
5
-
6
-
7
-
8
-
9
-
10
-
11
-
12
-
13
-
14
-
15
-
16
-
17
-
18
-
19
-
20
-
21
-
22
-
23
-
24
-
25
-
26
-
27
-
28
-
29
-
30
-
31
-
32
-
33
-
34
-
35
-
36
-
37
-
38
-
39
-
40
-
41
-
42
-
43
-
44
-
45
-
46
-
47
-
48
-
49
-
50
-
51
-
52
-
53
-
54
-
55
-
56
-
57
-
58
-
59
-
60
-
 61
61 -
 62
62 -
 63
63 -
 64
64 -
 65
65 -
 66
66 -
 67
67 -
 68
68 -
 69
69 -
 70
70 -
 71
71 -
 72
72 -
 73
73 -
 74
74 -
 75
75 -
 76
76 -
 77
77 -
 78
78 -
 79
79 -
 80
80 -
 81
81 -
82
-
83
-
84
-
85
-
86
-
87
-
88
-
89
-
90
-
91
-
92
-
93
-
94
-
95
-
96
-
97
-
98
-
99
-
100
-
101
-
102
-
103
-
104
-
105
-
106
-
107
-
108
-
109
-
110
-
111
-
112
-
113
-
114
-
115
-
116
-
117
-
118
-
119
-
120
-
121
-
122
-
123
-
124
-
125
-
126
-
127
-
128
-
129
-
130
-
131
-
132
-
133
-
134
-
135
-
136
-
137
-
138
-
139
-
140
-
141
-
142
-
143
-
144
-
145
-
146
-
147
-
148
-
149
-
150
-
151
-
152
-
153
-
154
-
155
-
156
-
157
-
158
-
159
-
160
-
161
-
162
-
163
-
164
-
165
-
166
-
167
-
168
-
169
-
170
-
171
-
172
-
173
-
174
-
175
-
176
-
177
-
178
-
179
-
180
-
181
-
182
-
183
-
184
-
185
-
186
-
187
-
188
-
189
-
190
-
191
-
192
-
193
-
194
-
195
-
196
 |
 |

Annual Report 2013-2014 69
Profit/(loss) on treasury-related activities (net)
Income from treasury-related activities includes income from sale of investments and revaluation of
investments on account of changes in unrealised profit/(loss) in the fixed income, equity and preference
share portfolio, units of venture funds and security receipts.
Profit from treasury-related activities was ` 10.17 billion in fiscal 2014 compared to ` 4.95 billion in fiscal
2013. The profit from treasury-related activities for fiscal 2014 includes higher gain on government
securities and other fixed income positions, profit on security receipts, realised gains/reversal of marked-
to-market losses on equity and preference share portfolio and other gains.
At March 31, 2014, the Bank had an outstanding net investment of ` 8.84 billion in security receipts
issued by asset reconstruction companies in relation to sale of non-performing loans compared to ` 11.47
billion at March 31, 2013. Security receipts issued by asset reconstruction companies are valued as per
net asset value obtained from the asset reconstruction company from time to time. During fiscal 2014,
the impact of these security receipts on the income from treasury-related activities was a gain of ` 1.97
billion compared to a gain of ` 0.45 billion in fiscal 2013.
Dividend from subsidiaries
Dividend from subsidiaries increased by 42.1% from ` 9.12 billion in fiscal 2013 to ` 12.96 billion in fiscal
2014. Dividend from subsidiaries of ` 12.96 billion in fiscal 2014 primarily includes dividend of ` 6.90
billion from ICICI Prudential Life Insurance Company Limited, ` 2.86 billion from ICICI Bank Canada, ` 1.54
billion from ICICI Bank UK and ` 1.14 billion from ICICI Home Finance Company Limited. Dividend from
subsidiaries of ` 9.12 billion in fiscal 2013 primarily included dividend of ` 3.27 billion from ICICI Prudential
Life Insurance Company Limited, ` 1.67 billion from ICICI Bank Canada, ` 1.39 billion from ICICI Home
Finance Company Limited and ` 1.31 billion from ICICI Bank UK.
Other income (including lease income)
Other income increased from ` 0.38 billion in fiscal 2013 to ` 3.57 billion in fiscal 2014 primarily on
account of exchange gain on repatriation of retained earnings from overseas branches and profit on sale
of properties. The profit on account of exchange gain on repatriation of retained earnings from overseas
branches amounted to ` 2.22 billion.
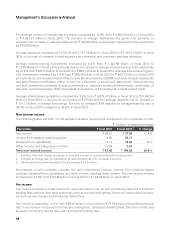
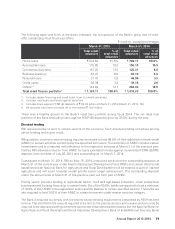
Non-interest expense
The following table sets forth, for the periods indicated, the principal components of non-interest expense.
` in billion, except percentages
Particulars Fiscal 2013 Fiscal 2014 % change
Payments to and provisions for employees ` 38.93 ` 42.20 8.4%
Depreciation on own property (including non
banking assets) 4.57 5.44 19.0
Other administrative expenses 46.30 55.13 19.1
Total non-interest expense (excluding lease depreciation) 89.80 102.77 14.4
Depreciation (net of lease equalisation) on leased assets 0.33 0.32 (3.0)
Total non-interest expense ` 90.13 ` 103.09 14.4%
1. All amounts have been rounded off to the nearest ` 10.0 million.
Non-interest expenses primarily include employee expenses, depreciation on assets and other
administrative expenses. Non-interest expenses increased by 14.4% from ` 90.13 billion in fiscal 2013 to
` 103.09 billion in fiscal 2014.