ICICI Bank 2014 Annual Report Download - page 170
Download and view the complete annual report
Please find page 170 of the 2014 ICICI Bank annual report below. You can navigate through the pages in the report by either clicking on the pages listed below, or by using the keyword search tool below to find specific information within the annual report.-
 1
1 -
2
-
3
-
4
-
5
-
6
-
7
-
8
-
9
-
10
-
11
-
12
-
13
-
14
-
15
-
16
-
17
-
18
-
19
-
20
-
21
-
22
-
23
-
24
-
25
-
26
-
27
-
28
-
29
-
30
-
31
-
32
-
33
-
34
-
35
-
36
-
37
-
38
-
39
-
40
-
41
-
42
-
43
-
44
-
45
-
46
-
47
-
48
-
49
-
50
-
51
-
52
-
53
-
54
-
55
-
56
-
57
-
58
-
59
-
60
-
61
-
62
-
63
-
64
-
65
-
66
-
67
-
68
-
69
-
70
-
71
-
72
-
73
-
74
-
75
-
76
-
77
-
78
-
79
-
80
-
81
-
82
-
83
-
84
-
85
-
86
-
87
-
88
-
89
-
90
-
91
-
92
-
93
-
94
-
95
-
96
-
97
-
98
-
99
-
100
-
101
-
102
-
103
-
104
-
105
-
106
-
107
-
108
-
109
-
110
-
111
-
112
-
113
-
114
-
115
-
116
-
117
-
118
-
119
-
120
-
121
-
122
-
123
-
124
-
125
-
126
-
127
-
128
-
129
-
130
-
131
-
132
-
133
-
134
-
135
-
136
-
137
-
138
-
139
-
140
-
141
-
142
-
143
-
144
-
145
-
146
-
147
-
148
-
149
-
150
-
151
-
152
-
153
-
154
-
155
-
156
-
157
-
158
-
159
-
 160
160 -
 161
161 -
 162
162 -
 163
163 -
 164
164 -
 165
165 -
 166
166 -
 167
167 -
 168
168 -
 169
169 -
 170
170 -
 171
171 -
 172
172 -
 173
173 -
 174
174 -
 175
175 -
 176
176 -
 177
177 -
 178
178 -
 179
179 -
 180
180 -
181
-
182
-
183
-
184
-
185
-
186
-
187
-
188
-
189
-
190
-
191
-
192
-
193
-
194
-
195
-
196
 |
 |

F82
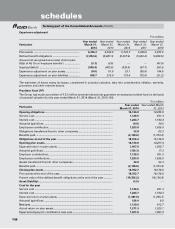
forming part of the Consolidated Accounts (Contd.)
schedules
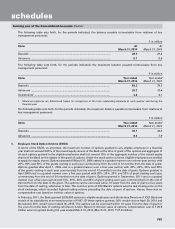
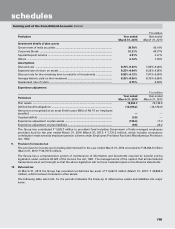
If ICICI Bank had used the fair value of options based on binomial tree model, compensation cost in the year ended
March 31, 2014 would have been higher by ` 2,359.8 million and proforma profit after tax would have been ` 95.74
billion. The key assumptions used to estimate the fair value of options granted during the year ended March 31, 2014
are given below.
Risk-free interest rate .......................................................................................................................... 7.60% to 9.12%
Expected life ........................................................................................................................................ 6.35 years
Expected volatility ............................................................................................................................... 48.70% to 48.96%
Expected dividend yield ..................................................................................................................... 1.70% to 1.96%
The weighted average fair value of options granted during the year ended March 31, 2014 is ` 592.94 per option (March
31, 2013: ` 434.91).
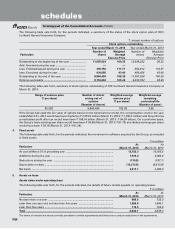
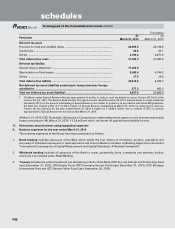
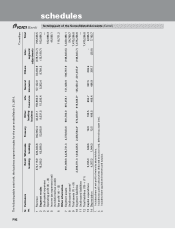
A summary of the status of the Bank’s stock option plan is given below.
`, except number of options
Stock options outstanding
Year ended March 31, 2014 Year ended March 31, 2013
Particulars
Number of
options
Weighted
Average
Exercise Price
Number of
options
Weighted
Average
Exercise Price
Outstanding at the beginning of the year ...................... 25,980,453 855.18 23,199,545 846.94
Add: Granted during the year ........................................ 4,419,650 1,177.17 4,450,200 844.53
Less: Lapsed during the year, net of re-issuance .......... 890,210 961.65 802,019 929.35
Less: Exercised during the year .................................... 1,405,540 530.56 867,273 511.63
Outstanding at the end of the year ................................ 28,104,353 918.68 25,980,453 855.18
Options exercisable ........................................................ 14,608,343 833.48 13,597,383 793.57
A summary of stock options outstanding at March 31, 2014 is given below.
Range of exercise price
(` per share)
Number of shares
arising out of
options
Weighted average
exercise price
(` per share)
Weighted average
remaining
contractual life
(Number of years)
300-599 4,082,048 482.39 2.44
600-999 16,041,045 917.49 5.66
1,000-1,399 7,981,260 1,144.22 8.15
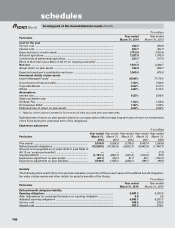
A summary of stock options outstanding at March 31, 2013 is given below.
Range of exercise price
(` per share)
Number of shares
arising out of
options
Weighted average
exercise price
(` per share)
Weighted average
remaining
contractual life
(Number of years)
105-299 12,675 132.05 0.07
300-599 5,229,338 470.26 3.35
600-999 16,827,750 917.10 6.66
1,000-1,399 3,910,690 1,105.80 8.06
The options were exercised regularly throughout the period and weighted average share price as per NSE price volume
data during the year ended March 31, 2014 was ` 1,046.61 (March 31, 2013: ` 1,000.21).