ICICI Bank 2014 Annual Report Download - page 108
Download and view the complete annual report
Please find page 108 of the 2014 ICICI Bank annual report below. You can navigate through the pages in the report by either clicking on the pages listed below, or by using the keyword search tool below to find specific information within the annual report.-
 1
1 -
2
-
3
-
4
-
5
-
6
-
7
-
8
-
9
-
10
-
11
-
12
-
13
-
14
-
15
-
16
-
17
-
18
-
19
-
20
-
21
-
22
-
23
-
24
-
25
-
26
-
27
-
28
-
29
-
30
-
31
-
32
-
33
-
34
-
35
-
36
-
37
-
38
-
39
-
40
-
41
-
42
-
43
-
44
-
45
-
46
-
47
-
48
-
49
-
50
-
51
-
52
-
53
-
54
-
55
-
56
-
57
-
58
-
59
-
60
-
61
-
62
-
63
-
64
-
65
-
66
-
67
-
68
-
69
-
70
-
71
-
72
-
73
-
74
-
75
-
76
-
77
-
78
-
79
-
80
-
81
-
82
-
83
-
84
-
85
-
86
-
87
-
88
-
89
-
90
-
91
-
92
-
93
-
94
-
95
-
96
-
97
-
 98
98 -
 99
99 -
 100
100 -
 101
101 -
 102
102 -
 103
103 -
 104
104 -
 105
105 -
 106
106 -
 107
107 -
 108
108 -
 109
109 -
 110
110 -
 111
111 -
 112
112 -
 113
113 -
 114
114 -
 115
115 -
 116
116 -
 117
117 -
 118
118 -
119
-
120
-
121
-
122
-
123
-
124
-
125
-
126
-
127
-
128
-
129
-
130
-
131
-
132
-
133
-
134
-
135
-
136
-
137
-
138
-
139
-
140
-
141
-
142
-
143
-
144
-
145
-
146
-
147
-
148
-
149
-
150
-
151
-
152
-
153
-
154
-
155
-
156
-
157
-
158
-
159
-
160
-
161
-
162
-
163
-
164
-
165
-
166
-
167
-
168
-
169
-
170
-
171
-
172
-
173
-
174
-
175
-
176
-
177
-
178
-
179
-
180
-
181
-
182
-
183
-
184
-
185
-
186
-
187
-
188
-
189
-
190
-
191
-
192
-
193
-
194
-
195
-
196
 |
 |

F20
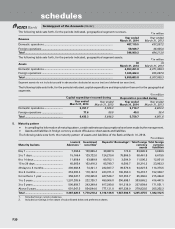
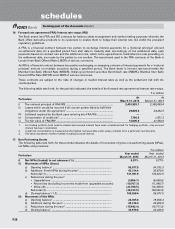
The following table sets forth, for the periods indicated, geographical segment revenues. ` in million
Revenue Year ended
March 31, 2014
Year ended
March 31, 2013
Domestic operations ............................................................................................. 487,110.5 437,287.2
Foreign operations ................................................................................................ 58,949.7 46,925.8
Total ....................................................................................................................... 546,060.2 484,213.0
The following table sets forth, for the periods indicated, geographical segment assets. ` in million
Assets At
March 31, 2014
At
March 31, 2013
Domestic operations ............................................................................................. 4,853,261.8 4,371,958.3
Foreign operations ................................................................................................ 1,046,422.0 935,097.0
Total ....................................................................................................................... 5,899,683.8 5,307,055.3
Segment assets do not include tax paid in advance/tax deducted at source (net) and deferred tax asset (net).
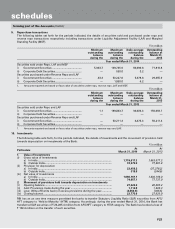
The following table sets forth, for the periods indicated, capital expenditure and depreciation thereon for the geographical
segments.
` in million
Capital expenditure incurred during Depreciation provided during
Year ended
March 31, 2014 Year ended
March 31, 2013
Year ended
March 31, 2014
Year ended
March 31, 2013
Domestic operations ......................... 6,357.7 5,566.3 5,710.7 4,863.2
Foreign operations ............................ 77.6 80.0 49.0 38.4
Total ................................................... 6,435.3 5,646.3 5,759.7 4,901.6
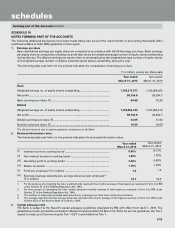
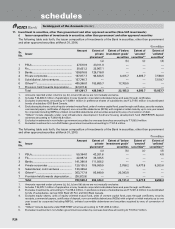
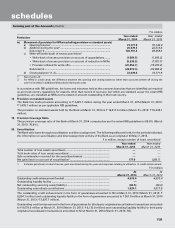
5. Maturity pattern
•In compiling the information of maturity pattern, certain estimates and assumptions have been made by the management.
•Assets and liabilities in foreign currency exclude off-balance sheet assets and liabilities.
The following table sets forth, the maturity pattern of assets and liabilities of the Bank at March 31, 2014.
` in million
Maturity buckets
Loans &
Advances 1
Investment
securities1
Deposits1Borrowings1,2 Total foreign
currency
assets
Total foreign
currency
liabilities
Day 1 .................................................. 7,090.4 100,869.4 30,987.9 173.8 83,845.9 3,628.9
2 to 7 days ......................................... 15,166.4 129,722.6 124,279.6 78,866.5 58,461.8 6,619.5
8 to 14 days ....................................... 11,959.4 63,889.9 80,752.1 3,004.0 11,590.2 12,801.0
15 to 28 days ..................................... 45,665.4 102,418.3 85,790.7 8,006.7 20,316.2 23,962.2
29 days to 3 months .......................... 200,983.8 74,321.1 232,027.7 99,579.6 94,827.5 114,376.6
3 to 6 months ..................................... 253,002.3 110,122.2 243,371.3 165,350.3 79,410.7 152,308.7
6 months to 1 year ............................ 358,047.7 218,245.0 427,548.7 197,353.7 65,366.6 215,464.8
1 to 3 years ........................................ 1,297,203.9 222,735.7 499,966.0 306,698.1 303,865.2 416,447.5
3 to 5 years ........................................ 596,859.7 243,349.4 817,290.8 191,218.9 237,859.4 171,501.1
Above 5 years .................................... 601,047.5 504,544.6 777,121.8 497,338.9 279,832.0 265,202.2
Total ................................................... 3,387,026.5 1,770,218.2 3,319,136.6 1,547,590.5 1,235,375.5 1,382,312.5
1. Includes foreign currency balances.
2. Includes borrowings in the nature of subordinated debts and preference shares.
forming part of the Accounts (Contd.)
schedules