ICICI Bank 2014 Annual Report Download - page 74
Download and view the complete annual report
Please find page 74 of the 2014 ICICI Bank annual report below. You can navigate through the pages in the report by either clicking on the pages listed below, or by using the keyword search tool below to find specific information within the annual report.-
 1
1 -
2
-
3
-
4
-
5
-
6
-
7
-
8
-
9
-
10
-
11
-
12
-
13
-
14
-
15
-
16
-
17
-
18
-
19
-
20
-
21
-
22
-
23
-
24
-
25
-
26
-
27
-
28
-
29
-
30
-
31
-
32
-
33
-
34
-
35
-
36
-
37
-
38
-
39
-
40
-
41
-
42
-
43
-
44
-
45
-
46
-
47
-
48
-
49
-
50
-
51
-
52
-
53
-
54
-
55
-
56
-
57
-
58
-
59
-
60
-
61
-
62
-
63
-
 64
64 -
 65
65 -
 66
66 -
 67
67 -
 68
68 -
 69
69 -
 70
70 -
 71
71 -
 72
72 -
 73
73 -
 74
74 -
 75
75 -
 76
76 -
 77
77 -
 78
78 -
 79
79 -
 80
80 -
 81
81 -
 82
82 -
 83
83 -
 84
84 -
85
-
86
-
87
-
88
-
89
-
90
-
91
-
92
-
93
-
94
-
95
-
96
-
97
-
98
-
99
-
100
-
101
-
102
-
103
-
104
-
105
-
106
-
107
-
108
-
109
-
110
-
111
-
112
-
113
-
114
-
115
-
116
-
117
-
118
-
119
-
120
-
121
-
122
-
123
-
124
-
125
-
126
-
127
-
128
-
129
-
130
-
131
-
132
-
133
-
134
-
135
-
136
-
137
-
138
-
139
-
140
-
141
-
142
-
143
-
144
-
145
-
146
-
147
-
148
-
149
-
150
-
151
-
152
-
153
-
154
-
155
-
156
-
157
-
158
-
159
-
160
-
161
-
162
-
163
-
164
-
165
-
166
-
167
-
168
-
169
-
170
-
171
-
172
-
173
-
174
-
175
-
176
-
177
-
178
-
179
-
180
-
181
-
182
-
183
-
184
-
185
-
186
-
187
-
188
-
189
-
190
-
191
-
192
-
193
-
194
-
195
-
196
 |
 |
Management’s Discussion & Analysis
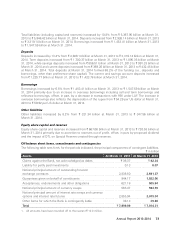
72
Cash and cash equivalents
Cash and cash equivalents include cash in hand and balances with RBI and other banks, including money
at call and short notice. Cash and cash equivalents increased from ` 414.18 billion at March 31, 2013 to
` 415.30 billion at March 31, 2014 primarily due to increase in money at call and short notice and balances
with RBI, offset, in part, by a decrease in deposits with other banks and term money lent.
Investments
Total investments increased by 3.3% from ` 1,713.94 billion at March 31, 2013 to ` 1,770.22 billion at
March 31, 2014, primarily due to an increase in RIDF and other related investments made pursuant to
shortfall in directed lending requirements by ` 46.21 billion, pass through certificates by ` 42.01 billion
and investment in government securities by ` 27.89 billion. Corporate bonds and debentures decreased
by ` 53.58 billion and commercial paper and certificates of deposit decreased by ` 16.25 billion at March
31, 2014 compared to March 31, 2013.
Advances
Net advances increased by 16.7% from ` 2,902.49 billion at March 31, 2013 to ` 3,387.03 billion at
March 31, 2014 primarily due to increase in retail advances and overseas corporate advances. Net retail
advances increased by 23.0% from ` 1,073.59 billion at March 31, 2013 to ` 1,320.11 billion at March 31,
2014. Net advances of overseas branches (including offshore banking unit), in dollar terms, increased by
11.1% from US$ 13.5 billion at March 31, 2013 to US$ 15.0 billion at March 31, 2014. However, due to
rupee depreciation from ` 54.29 per US dollar at March 31, 2013 to ` 59.92 per US dollar at March 31,
2014, net advances of overseas branches (including offshore banking unit), in rupee terms, increased by
22.3% from ` 733.57 billion at March 31, 2013 to ` 896.96 billion at March 31, 2014.
Fixed and other assets
Fixed assets (net block) increased marginally from ` 46.47 billion at March 31, 2013 to ` 46.78 billion at
March 31, 2014. Other assets increased from ` 290.87 billion at March 31, 2013 to ` 327.09 billion at
March 31, 2014.
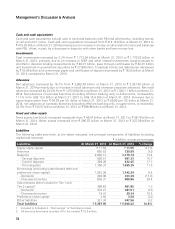
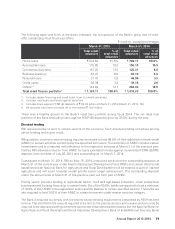
Liabilities
The following table sets forth, at the dates indicated, the principal components of liabilities (including
capital and reserves). ` in billion, except percentages
Liabilities At March 31, 2013 At March 31, 2014 % change
Equity share capital ` 11.54 ` 11.55 0.1%
Reserves 655.52 720.58 9.9
Deposits 2,926.14 3,319.14 13.4
- Savings deposits 856.51 991.33 15.7
- Current deposits 369.26 432.45 17.1
- Term deposits 1,700.37 1,895.35 11.5
Borrowings (excluding subordinated debt and
preference share capital) 1,053.29 1,142.24 8.4
- Domestic 402.98 333.38 (17.3)
- Overseas branches 650.31 808.86 24.4
Subordinated debt (included in Tier-1 and
Tier-2 capital)1396.62 401.85 1.3
- Domestic 378.21 381.51 0.9
- Overseas branches 18.41 20.34 10.5
Preference share capital13.50 3.50 0.0
Other liabilities 321.34 347.56 8.2
Total liabilities ` 5,367.95 ` 5,946.42 10.8%
1. Included in Schedule 4 - “Borrowings” of the balance sheet.
2. All amounts have been rounded off to the nearest ` 10.0 million.
Management’s Discussion & Analysis