ICICI Bank 2014 Annual Report Download - page 70
Download and view the complete annual report
Please find page 70 of the 2014 ICICI Bank annual report below. You can navigate through the pages in the report by either clicking on the pages listed below, or by using the keyword search tool below to find specific information within the annual report.-
 1
1 -
2
-
3
-
4
-
5
-
6
-
7
-
8
-
9
-
10
-
11
-
12
-
13
-
14
-
15
-
16
-
17
-
18
-
19
-
20
-
21
-
22
-
23
-
24
-
25
-
26
-
27
-
28
-
29
-
30
-
31
-
32
-
33
-
34
-
35
-
36
-
37
-
38
-
39
-
40
-
41
-
42
-
43
-
44
-
45
-
46
-
47
-
48
-
49
-
50
-
51
-
52
-
53
-
54
-
55
-
56
-
57
-
58
-
59
-
 60
60 -
 61
61 -
 62
62 -
 63
63 -
 64
64 -
 65
65 -
 66
66 -
 67
67 -
 68
68 -
 69
69 -
 70
70 -
 71
71 -
 72
72 -
 73
73 -
 74
74 -
 75
75 -
 76
76 -
 77
77 -
 78
78 -
 79
79 -
 80
80 -
81
-
82
-
83
-
84
-
85
-
86
-
87
-
88
-
89
-
90
-
91
-
92
-
93
-
94
-
95
-
96
-
97
-
98
-
99
-
100
-
101
-
102
-
103
-
104
-
105
-
106
-
107
-
108
-
109
-
110
-
111
-
112
-
113
-
114
-
115
-
116
-
117
-
118
-
119
-
120
-
121
-
122
-
123
-
124
-
125
-
126
-
127
-
128
-
129
-
130
-
131
-
132
-
133
-
134
-
135
-
136
-
137
-
138
-
139
-
140
-
141
-
142
-
143
-
144
-
145
-
146
-
147
-
148
-
149
-
150
-
151
-
152
-
153
-
154
-
155
-
156
-
157
-
158
-
159
-
160
-
161
-
162
-
163
-
164
-
165
-
166
-
167
-
168
-
169
-
170
-
171
-
172
-
173
-
174
-
175
-
176
-
177
-
178
-
179
-
180
-
181
-
182
-
183
-
184
-
185
-
186
-
187
-
188
-
189
-
190
-
191
-
192
-
193
-
194
-
195
-
196
 |
 |

Management’s Discussion & Analysis
68
The average volume of interest-earning assets increased by 10.9% from ` 4,465.40 billion in fiscal 2013
to ` 4,951.57 billion in fiscal 2014. The increase in average interest-earning assets was primarily on
account of an increase in average advances by ` 393.02 billion and average interest-earning investments
by `120.06 billion.
Average advances increased by 14.3% from ` 2,751.19 billion in fiscal 2013 to ` 3,144.21 billion in fiscal
2014 on account of increase in retail advances and domestic and overseas corporate advances.
Average interest-earning investments increased by 8.4% from ` 1,424.90 billion in fiscal 2013 to
` 1,544.96 billion in fiscal 2014, primarily due to an increase in average interest-earning SLR investments
by 12.8% from ` 855.54 billion in fiscal 2013 to ` 964.73 billion in fiscal 2014. Average interest-earning non-
SLR investments increased by 1.9% from ` 569.36 billion in fiscal 2013 to ` 580.23 billion in fiscal 2014
primarily due to an increase in Rural Infrastructure Development Fund (RIDF) and other related investments
and pass through certificates, offset, in part, by a decrease in bonds and debentures. Interest-earning
non-SLR investments primarily include investments in corporate bonds and debentures, certificates of
deposits, commercial paper, RIDF and related investments and investments in liquid mutual funds.
Average interest-bearing liabilities increased by 9.6% from ` 4,073.47 billion in fiscal 2013 to ` 4,462.54
billion in fiscal 2014 on account of an increase of ` 273.94 billion in average deposits and an increase of
` 115.13 billion in average borrowings. The ratio of average CASA deposits to average deposits was at
39.4% in fiscal 2014 compared to 38.0% in fiscal 2013.
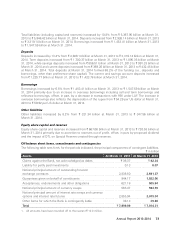
Non-interest income
The following tables set forth, for the periods indicated, the principal components of non-interest income.
` in billion, except percentages
Particulars Fiscal 2013 Fiscal 2014 % change
Fee income1` 69.01 ` 77.58 12.4%
Income from treasury-related activities 4.95 10.17 —
Dividend from subsidiaries 9.12 12.96 42.1
Other income (including lease income)20.38 3.57 —
Total non-interest income ` 83.46 ` 104.28 24.9%
1. Includes merchant foreign exchange income and income on customer derivative transactions.
2. Includes exchange gain on repatriation of retained earnings from overseas branches.
3. All amounts have been rounded off to the nearest ` 10.0 million.
Non-interest income primarily includes fee and commission income, income from treasury-related
activities, dividend from subsidiaries and other income including lease income. The non-interest income
increased by 24.9% from ` 83.46 billion in fiscal 2013 to ` 104.28 billion in fiscal 2014.
Fee income
Fee income primarily includes fees from corporate clients such as loan processing fees and transaction
banking fees and fees from retail customers such as loan processing fees, fees from credit cards business,
account service charges and third party referral fees.
Fee income increased by 12.4% from ` 69.01 billion in fiscal 2013 to ` 77.58 billion in fiscal 2014 primarily
due to an increase in income from loan processing fees, transaction banking fees, fees from credit card
business, third party referral fees and commercial banking fees.
Management’s Discussion & Analysis