ICICI Bank 2014 Annual Report Download - page 73
Download and view the complete annual report
Please find page 73 of the 2014 ICICI Bank annual report below. You can navigate through the pages in the report by either clicking on the pages listed below, or by using the keyword search tool below to find specific information within the annual report.-
 1
1 -
2
-
3
-
4
-
5
-
6
-
7
-
8
-
9
-
10
-
11
-
12
-
13
-
14
-
15
-
16
-
17
-
18
-
19
-
20
-
21
-
22
-
23
-
24
-
25
-
26
-
27
-
28
-
29
-
30
-
31
-
32
-
33
-
34
-
35
-
36
-
37
-
38
-
39
-
40
-
41
-
42
-
43
-
44
-
45
-
46
-
47
-
48
-
49
-
50
-
51
-
52
-
53
-
54
-
55
-
56
-
57
-
58
-
59
-
60
-
61
-
62
-
 63
63 -
 64
64 -
 65
65 -
 66
66 -
 67
67 -
 68
68 -
 69
69 -
 70
70 -
 71
71 -
 72
72 -
 73
73 -
 74
74 -
 75
75 -
 76
76 -
 77
77 -
 78
78 -
 79
79 -
 80
80 -
 81
81 -
 82
82 -
 83
83 -
84
-
85
-
86
-
87
-
88
-
89
-
90
-
91
-
92
-
93
-
94
-
95
-
96
-
97
-
98
-
99
-
100
-
101
-
102
-
103
-
104
-
105
-
106
-
107
-
108
-
109
-
110
-
111
-
112
-
113
-
114
-
115
-
116
-
117
-
118
-
119
-
120
-
121
-
122
-
123
-
124
-
125
-
126
-
127
-
128
-
129
-
130
-
131
-
132
-
133
-
134
-
135
-
136
-
137
-
138
-
139
-
140
-
141
-
142
-
143
-
144
-
145
-
146
-
147
-
148
-
149
-
150
-
151
-
152
-
153
-
154
-
155
-
156
-
157
-
158
-
159
-
160
-
161
-
162
-
163
-
164
-
165
-
166
-
167
-
168
-
169
-
170
-
171
-
172
-
173
-
174
-
175
-
176
-
177
-
178
-
179
-
180
-
181
-
182
-
183
-
184
-
185
-
186
-
187
-
188
-
189
-
190
-
191
-
192
-
193
-
194
-
195
-
196
 |
 |

Annual Report 2013-2014 71
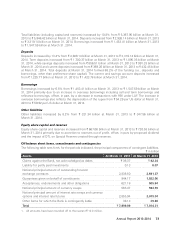
Provision for investments decreased from ` 1.26 billion in fiscal 2013 to ` 0.71 billion in fiscal 2014.
The provision for investments of ` 1.26 billion in fiscal 2013 was primarily due to permanent diminution
recognised on certain investments.
The provision coverage ratio at March 31, 2014 computed as per the extant RBI guidelines was 68.6%.
Provision on standard assets increased from ` 1.44 billion in fiscal 2013 to ` 2.49 billion in fiscal 2014
reflecting an increase in the loan portfolio and higher provision on restructured loans. The Bank held a
cumulative general provision of ` 19.32 billion at March 31, 2014.
Tax expense
The income tax expense (including wealth tax) increased by 35.4% from ` 30.71 billion in fiscal 2013 to
` 41.58 billion in fiscal 2014. The effective tax rate increased from 26.9% in fiscal 2013 to 29.8% in fiscal
2014. The increase in effective tax rate was primarily due to creation of deferred tax liability (DTL) on
special reserve and increase in surcharge from 5.0% in fiscal 2013 to 10.0% in fiscal 2014.
The Bank creates Special Reserve through appropriation of profits, in order to avail tax deduction as per
Section 36(1) (viii) of the Income Tax Act, 1961. The Reserve Bank of India, through its circular dated
December 20, 2013, advised the banks to create a DTL on the amount outstanding in Special Reserve, as
a matter of prudence. In accordance with these RBI guidelines, the Bank created a DTL of ` 14.19 billion
on Special Reserve outstanding at March 31, 2013, by reducing the reserves. Further, the tax expense for
fiscal 2014 was higher by ` 3.04 billion due to creation of DTL on the estimated Special Reserve for the
year ended March 31, 2014.
Financial condition
Assets
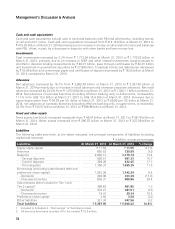
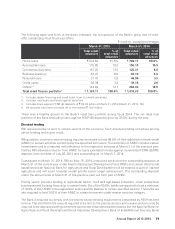
The following table sets forth, at the dates indicated, the principal components of assets.
` in billion, except percentages
Assets At March 31, 2013 At March 31, 2014 % change
Cash and bank balances ` 414.18 ` 415.30 0.3%
Investments 1,713.94 1,770.22 3.3
- Government and other approved investments1923.76 951.65 3.0
- RIDF and other related investments2201.98 248.19 22.9
- Equity investment in subsidiaries 123.22 120.22 (2.4)
- Other investments 464.98 450.16 (3.2)
Advances 2,902.49 3,387.03 16.7
- Domestic 2,168.92 2,490.07 14.8
- Overseas branches 733.57 896.96 22.3
Fixed assets (including leased assets) 46.47 46.78 0.7
Other assets 290.87 327.09 12.5
Total assets ` 5,367.95 ` 5,946.42 10.8%
1. Banks in India are required to maintain a specified percentage, currently 23.0%, of their net demand and time
liabilities by way of liquid assets like cash, gold or approved unencumbered securities.
2. Investments made in Rural Infrastructure Development Fund and other such entities pursuant to shortfall in the
amount required to be lent to certain specified sectors called priority sector as per RBI guidelines.
3. All amounts have been rounded off to the nearest ` 10.0 million.
Total assets of the Bank increased by 10.8% from ` 5,367.95 billion at March 31, 2013 to ` 5,946.42
billion at March 31, 2014. Net advances increased by 16.7% from ` 2,902.49 billion at March 31, 2013
to ` 3,387.03 billion at March 31, 2014. Investments increased by 3.3% from ` 1,713.94 billion at
March 31, 2013 to ` 1,770.22 billion at March 31, 2014.