ICICI Bank 2014 Annual Report Download - page 154
Download and view the complete annual report
Please find page 154 of the 2014 ICICI Bank annual report below. You can navigate through the pages in the report by either clicking on the pages listed below, or by using the keyword search tool below to find specific information within the annual report.-
 1
1 -
2
-
3
-
4
-
5
-
6
-
7
-
8
-
9
-
10
-
11
-
12
-
13
-
14
-
15
-
16
-
17
-
18
-
19
-
20
-
21
-
22
-
23
-
24
-
25
-
26
-
27
-
28
-
29
-
30
-
31
-
32
-
33
-
34
-
35
-
36
-
37
-
38
-
39
-
40
-
41
-
42
-
43
-
44
-
45
-
46
-
47
-
48
-
49
-
50
-
51
-
52
-
53
-
54
-
55
-
56
-
57
-
58
-
59
-
60
-
61
-
62
-
63
-
64
-
65
-
66
-
67
-
68
-
69
-
70
-
71
-
72
-
73
-
74
-
75
-
76
-
77
-
78
-
79
-
80
-
81
-
82
-
83
-
84
-
85
-
86
-
87
-
88
-
89
-
90
-
91
-
92
-
93
-
94
-
95
-
96
-
97
-
98
-
99
-
100
-
101
-
102
-
103
-
104
-
105
-
106
-
107
-
108
-
109
-
110
-
111
-
112
-
113
-
114
-
115
-
116
-
117
-
118
-
119
-
120
-
121
-
122
-
123
-
124
-
125
-
126
-
127
-
128
-
129
-
130
-
131
-
132
-
133
-
134
-
135
-
136
-
137
-
138
-
139
-
140
-
141
-
142
-
143
-
 144
144 -
 145
145 -
 146
146 -
 147
147 -
 148
148 -
 149
149 -
 150
150 -
 151
151 -
 152
152 -
 153
153 -
 154
154 -
 155
155 -
 156
156 -
 157
157 -
 158
158 -
 159
159 -
 160
160 -
 161
161 -
 162
162 -
 163
163 -
 164
164 -
165
-
166
-
167
-
168
-
169
-
170
-
171
-
172
-
173
-
174
-
175
-
176
-
177
-
178
-
179
-
180
-
181
-
182
-
183
-
184
-
185
-
186
-
187
-
188
-
189
-
190
-
191
-
192
-
193
-
194
-
195
-
196
 |
 |

F66
At
31.03.2014
At
31.03.2013
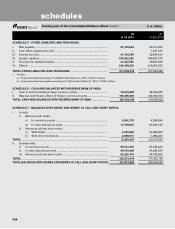
SCHEDULE 10 - FIXED ASSETS
I. Premises
At cost at March 31 of preceding year ........................................................... 47,180,039 46,967,168
Additions during the year ............................................................................... 1,697,914 1,710,528
Deductions during the year ............................................................................ (948,519) (1,497,657)
Depreciation to date1 ....................................................................................... (11,149,408) (9,896,489)
Net block2 ........................................................................................................ 36,780,026 37,283,550
II. Other fixed assets (including furniture and fixtures)
At cost at March 31 of preceding year .......................................................... 47,651,424 45,135,661
Additions during the year .............................................................................. 6,357,365 5,449,314
Deductions during the year ........................................................................... (3,207,297) (2,933,551)
Depreciation to date3 ...................................................................................... (34,846,830) (32,548,701)
Net block ........................................................................................................ 15,954,662 15,102,723
III. Assets given on Lease
At cost at March 31 of preceding year .......................................................... 17,509,544 17,509,544
Additions during the year ............................................................................... ——
Deductions during the year ............................................................................ (210,000) —
Depreciation to date, accumulated lease adjustment and provisions4 ........ (14,965,932) (15,161,230)
Net block ......................................................................................................... 2,333,612 2,348,314
TOTAL FIXED ASSETS ........................................................................................... 55,068,300 54,734,587
1. Includes depreciation charge amounting to ` 1,607.5 million (March 31, 2013: ` 1,638.8 million).
2. Includes assets of ` 12.7 million of the Bank (March 31, 2013: Nil) which are held for sale.
3. Includes depreciation charge amounting to ` 5,268.2 million (March 31, 2013: ` 4,590.9 million).
4. Includes depreciation charge/lease adjustment amounting to ` 317.0 million (March 31, 2013: ` 328.2 million).
SCHEDULE 11 - OTHER ASSETS
I. Inter-office adjustments (net) ....................................................................... 1,816,918 —
II. Interest accrued ............................................................................................. 58,486,747 55,093,457
III. Tax paid in advance/tax deducted at source (net) ....................................... 45,492,908 41,873,082
I V. Stationery and stamps .................................................................................. 2,995 10,045
V. Non-banking assets acquired in satisfaction of claims1 .............................. 850,871 576,833
VI. Advance for capital assets ............................................................................ 1,189,102 1,358,102
VII. Deposits ......................................................................................................... 13,352,863 12,256,273
VIII. Deferred tax asset (net)2 ................................................................................ 9,297,824 26,805,959
IX. Others3 ........................................................................................................... 257,603,765 205,392,184
TOTAL OTHER ASSETS ......................................................................................... 388,093,993 343,365,935
1. Includes certain non-banking assets acquired in satisfaction of claims which are in the process of being transferred in the Bank’s name.
2.
At March 31, 2014, net of deferred tax liabilities amounting to ` 14,192.3 million created on balance in Special Reserve at March 31, 2013 and ` 3,042.6
million on amount transferred to Special Reserve for the year ended March 31, 2014 in accordance with the RBI circular dated December 20, 2013.
3. Includes goodwill on consolidation amounting to ` 1,432.3 million (March 31, 2013: ` 1,432.3 million).
SCHEDULE 12 - CONTINGENT LIABILITIES
I. Claims against the Group not acknowledged as debts ................................ 47,940,741 53,721,418
II. Liability for partly paid investments .............................................................. 65,787 128,050
III. Liability on account of outstanding forward exchange contracts1 ............... 2,856,365,473 2,984,263,552
I V. Guarantees given on behalf of constituents
a) In India ...................................................................................................... 759,742,814 718,450,966
b) Outside India ............................................................................................. 274,562,600 235,173,947
V. Acceptances, endorsements and other obligations .................................... 506,296,301 623,110,066
VI. Currency swaps1 ............................................................................................ 615,713,817 563,086,874
VII. Interest rate swaps, currency options and interest rate futures1 ................. 4,040,069,738 3,924,345,424
VIII. Other items for which the Group is contingently liable ............................... 40,500,690 37,431,907
TOTAL CONTINGENT LIABILITIES ........................................................................ 9,141,257,961 9,139,712,204
1. Represents notional amount.
forming part of the Consolidated Balance Sheet (Contd.) (` in ‘000s)
schedules