ICICI Bank 2014 Annual Report Download - page 83
Download and view the complete annual report
Please find page 83 of the 2014 ICICI Bank annual report below. You can navigate through the pages in the report by either clicking on the pages listed below, or by using the keyword search tool below to find specific information within the annual report.-
 1
1 -
2
-
3
-
4
-
5
-
6
-
7
-
8
-
9
-
10
-
11
-
12
-
13
-
14
-
15
-
16
-
17
-
18
-
19
-
20
-
21
-
22
-
23
-
24
-
25
-
26
-
27
-
28
-
29
-
30
-
31
-
32
-
33
-
34
-
35
-
36
-
37
-
38
-
39
-
40
-
41
-
42
-
43
-
44
-
45
-
46
-
47
-
48
-
49
-
50
-
51
-
52
-
53
-
54
-
55
-
56
-
57
-
58
-
59
-
60
-
61
-
62
-
63
-
64
-
65
-
66
-
67
-
68
-
69
-
70
-
71
-
72
-
 73
73 -
 74
74 -
 75
75 -
 76
76 -
 77
77 -
 78
78 -
 79
79 -
 80
80 -
 81
81 -
 82
82 -
 83
83 -
 84
84 -
 85
85 -
 86
86 -
 87
87 -
 88
88 -
 89
89 -
 90
90 -
 91
91 -
 92
92 -
 93
93 -
94
-
95
-
96
-
97
-
98
-
99
-
100
-
101
-
102
-
103
-
104
-
105
-
106
-
107
-
108
-
109
-
110
-
111
-
112
-
113
-
114
-
115
-
116
-
117
-
118
-
119
-
120
-
121
-
122
-
123
-
124
-
125
-
126
-
127
-
128
-
129
-
130
-
131
-
132
-
133
-
134
-
135
-
136
-
137
-
138
-
139
-
140
-
141
-
142
-
143
-
144
-
145
-
146
-
147
-
148
-
149
-
150
-
151
-
152
-
153
-
154
-
155
-
156
-
157
-
158
-
159
-
160
-
161
-
162
-
163
-
164
-
165
-
166
-
167
-
168
-
169
-
170
-
171
-
172
-
173
-
174
-
175
-
176
-
177
-
178
-
179
-
180
-
181
-
182
-
183
-
184
-
185
-
186
-
187
-
188
-
189
-
190
-
191
-
192
-
193
-
194
-
195
-
196
 |
 |

Annual Report 2013-2014 81
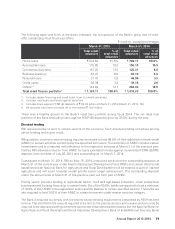
At March 31, 2014, gross NPAs (net of write-offs, interest suspense and derivatives income reversal) were
` 105.54 billion compared to ` 96.47 billion at March 31, 2013. Net NPAs were ` 33.01 billion at March 31,
2014 compared to ` 22.34 billion at March 31, 2013. The ratio of net NPAs to net customer assets increased
from 0.64% at March 31, 2013 to 0.82% at March 31, 2014. During fiscal 2014, the Bank wrote-off NPAs,
including retail NPAs, with an aggregate outstanding of ` 21.77 billion compared to ` 16.46 billion during
fiscal 2013.
Provision coverage ratio of the Bank (i.e. total provisions made against NPAs as a percentage of gross NPAs)
at March 31, 2014 was 68.6%. At March 31, 2014, total general provision held against standard assets was
` 19.32 billion.
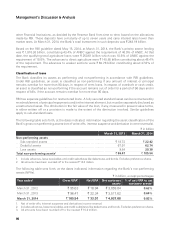
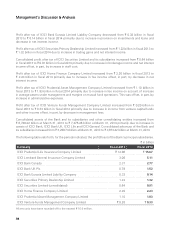
The following table sets forth, at March 31, 2013 and March 31, 2014, the composition of gross non-
performing assets by industry sector.
` in billion, except percentages
March 31, 2013 March 31, 2014
Amount % Amount %
Retail finance1` 58.14 60.3% ` 41.17 39.0%
Road, ports, telecom, urban development
and other infrastructure 0.14 0.1 8.19 7.8
Power 0.09 0.1 0.07 0.1
Services – non-finance 8.77 9.1 15.18 14.4
Iron/steel and products 1.99 2.1 2.43 2.3
Services – finance 0.00 0.0 0.57 0.5
Crude petroleum/refining and
petrochemicals 0.04 0.0 0.02 0.0
Construction 2.24 2.3 3.19 3.0
Electronics and engineering 2.59 2.7 2.93 2.8
Cement — — 0.30 0.3
Food and beverages 1.94 2.0 3.68 3.5
Metal & products (excluding iron & steel) 1.06 1.1 1.05 1.0
Wholesale/retail trade 4.16 4.3 4.07 3.9
Mining 0.20 0.2 0.20 0.2
Shipping 0.38 0.4 0.67 0.6
Manufacturing products (excluding metal) 1.33 1.4 1.25 1.2
Other industries2 13.40 13.9 20.57 19.4
Total ` 96.47 100.0% ` 105.54 100.0%
1. Includes home loans, automobile loans, commercial business loans, dealer financing and small ticket loans to
small businesses, personal loans, credit cards, rural loans and loans against securities.
2. Other industries primarily include textile, chemical and fertilisers, gems and jewellery, drugs and pharmaceuticals,
FMCG, automobiles and developer financing.
3. All amounts have been rounded off to the nearest ` 10.0 million.
At March 31, 2014, net non-performing loans in the retail portfolio were 0.62% of net retail loans as
compared with 0.72% at March 31, 2013. The decline in the ratio was primarily on account of continued
low in accretion to retail NPAs.