ICICI Bank 2014 Annual Report Download - page 82
Download and view the complete annual report
Please find page 82 of the 2014 ICICI Bank annual report below. You can navigate through the pages in the report by either clicking on the pages listed below, or by using the keyword search tool below to find specific information within the annual report.-
 1
1 -
2
-
3
-
4
-
5
-
6
-
7
-
8
-
9
-
10
-
11
-
12
-
13
-
14
-
15
-
16
-
17
-
18
-
19
-
20
-
21
-
22
-
23
-
24
-
25
-
26
-
27
-
28
-
29
-
30
-
31
-
32
-
33
-
34
-
35
-
36
-
37
-
38
-
39
-
40
-
41
-
42
-
43
-
44
-
45
-
46
-
47
-
48
-
49
-
50
-
51
-
52
-
53
-
54
-
55
-
56
-
57
-
58
-
59
-
60
-
61
-
62
-
63
-
64
-
65
-
66
-
67
-
68
-
69
-
70
-
71
-
 72
72 -
 73
73 -
 74
74 -
 75
75 -
 76
76 -
 77
77 -
 78
78 -
 79
79 -
 80
80 -
 81
81 -
 82
82 -
 83
83 -
 84
84 -
 85
85 -
 86
86 -
 87
87 -
 88
88 -
 89
89 -
 90
90 -
 91
91 -
 92
92 -
93
-
94
-
95
-
96
-
97
-
98
-
99
-
100
-
101
-
102
-
103
-
104
-
105
-
106
-
107
-
108
-
109
-
110
-
111
-
112
-
113
-
114
-
115
-
116
-
117
-
118
-
119
-
120
-
121
-
122
-
123
-
124
-
125
-
126
-
127
-
128
-
129
-
130
-
131
-
132
-
133
-
134
-
135
-
136
-
137
-
138
-
139
-
140
-
141
-
142
-
143
-
144
-
145
-
146
-
147
-
148
-
149
-
150
-
151
-
152
-
153
-
154
-
155
-
156
-
157
-
158
-
159
-
160
-
161
-
162
-
163
-
164
-
165
-
166
-
167
-
168
-
169
-
170
-
171
-
172
-
173
-
174
-
175
-
176
-
177
-
178
-
179
-
180
-
181
-
182
-
183
-
184
-
185
-
186
-
187
-
188
-
189
-
190
-
191
-
192
-
193
-
194
-
195
-
196
 |
 |

Management’s Discussion & Analysis
80
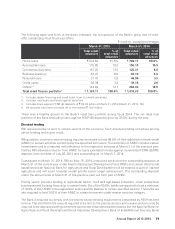
other Financial Institutions, as decided by the Reserve Bank from time to time, based on the allocations
made by RBI. These deposits have a maturity of up to seven years and carry interest rates lower than
market rates. At March 31, 2014, the Bank’s total investment in such deposits was ` 248.19 billion.
Based on the RBI guideline dated May 15, 2014, at March 31, 2014, the Bank’s priority sector lending
was ` 1,010.30 billion, constituting 43.4% of ANBC against the requirement of 40.0% of ANBC. At that
date, the qualifying total agriculture loans were ` 250.61 billion which was 10.8% of ANBC against the
requirement of 18.0%. The advances to direct agriculture were ` 145.85 billion constituting about 46.4%
of the requirement. The advances to weaker sections were ` 62.78 billion constituting about 27.0% of
the requirement.
Classification of loans
The Bank classifies its assets as performing and non-performing in accordance with RBI guidelines.
Under RBI guidelines, an asset is classified as non-performing if any amount of interest or principal
remains overdue for more than 90 days, in respect of term loans. In respect of overdraft or cash credit,
an asset is classified as non-performing if the account remains out of order for a period of 90 days and in
respect of bills, if the account remains overdue for more than 90 days.
RBI has separate guidelines for restructured loans. A fully secured standard asset can be restructured by
re-schedulement of principal repayments and/or the interest element, but must be separately disclosed as
a restructured asset. The diminution in the fair value of the loan, if any, measured in present value terms,
is either written off or a provision is made to the extent of the diminution involved. Similar guidelines
apply to sub-standard loans.
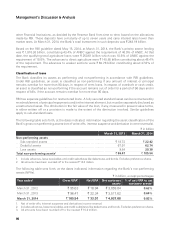
The following table sets forth, at the dates indicated, information regarding the asset classification of the
Bank’s gross non-performing assets (net of write-offs, interest suspense and derivative income reversals).
` in billion
March 31, 2013 March 31, 2014
Non-performing assets
Sub-standard assets ` 18.72 ` 22.42
Doubtful assets 67.91 62.74
Loss assets 9.84 20.38
Total non-performing assets1` 96.47 ` 105.54
1. Include advances, lease receivables and credit substitutes like debentures and bonds. Excludes preference shares.
2. All amounts have been rounded off to the nearest ` 10.0 million.
The following table sets forth, at the dates indicated, information regarding the Bank’s non-performing
assets (NPAs).
` in billion, except percentages
Year ended Gross NPA1Net NPA Net customer
assets
% of net NPA to net
customer assets2
March 31, 2012 ` 95.63 ` 18.94 ` 3,059.84 0.62%
March 31, 2013 ` 96.47 ` 22.34 ` 3,517.62 0.64%
March 31, 2014 ` 105.54 ` 33.01 ` 4,037.08 0.82%
1. Net of write-offs, interest suspense and derivatives income reversal.
2. Includes advances, lease receivables and credit substitutes like debentures and bonds. Excludes preference shares.
3. All amounts have been rounded off to the nearest ` 10.0 million.
Management’s Discussion & Analysis