ICICI Bank 2014 Annual Report Download - page 181
Download and view the complete annual report
Please find page 181 of the 2014 ICICI Bank annual report below. You can navigate through the pages in the report by either clicking on the pages listed below, or by using the keyword search tool below to find specific information within the annual report.-
 1
1 -
2
-
3
-
4
-
5
-
6
-
7
-
8
-
9
-
10
-
11
-
12
-
13
-
14
-
15
-
16
-
17
-
18
-
19
-
20
-
21
-
22
-
23
-
24
-
25
-
26
-
27
-
28
-
29
-
30
-
31
-
32
-
33
-
34
-
35
-
36
-
37
-
38
-
39
-
40
-
41
-
42
-
43
-
44
-
45
-
46
-
47
-
48
-
49
-
50
-
51
-
52
-
53
-
54
-
55
-
56
-
57
-
58
-
59
-
60
-
61
-
62
-
63
-
64
-
65
-
66
-
67
-
68
-
69
-
70
-
71
-
72
-
73
-
74
-
75
-
76
-
77
-
78
-
79
-
80
-
81
-
82
-
83
-
84
-
85
-
86
-
87
-
88
-
89
-
90
-
91
-
92
-
93
-
94
-
95
-
96
-
97
-
98
-
99
-
100
-
101
-
102
-
103
-
104
-
105
-
106
-
107
-
108
-
109
-
110
-
111
-
112
-
113
-
114
-
115
-
116
-
117
-
118
-
119
-
120
-
121
-
122
-
123
-
124
-
125
-
126
-
127
-
128
-
129
-
130
-
131
-
132
-
133
-
134
-
135
-
136
-
137
-
138
-
139
-
140
-
141
-
142
-
143
-
144
-
145
-
146
-
147
-
148
-
149
-
150
-
151
-
152
-
153
-
154
-
155
-
156
-
157
-
158
-
159
-
160
-
161
-
162
-
163
-
164
-
165
-
166
-
167
-
168
-
169
-
170
-
 171
171 -
 172
172 -
 173
173 -
 174
174 -
 175
175 -
 176
176 -
 177
177 -
 178
178 -
 179
179 -
 180
180 -
 181
181 -
 182
182 -
 183
183 -
 184
184 -
 185
185 -
 186
186 -
 187
187 -
 188
188 -
 189
189 -
 190
190 -
 191
191 -
192
-
193
-
194
-
195
-
196
 |
 |

F93
forming part of the Consolidated Accounts (Contd.)
schedules
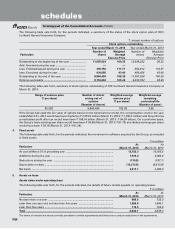
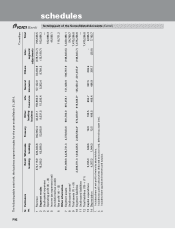
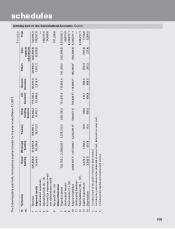
The following table sets forth, the business segment results for the year ended March 31, 2013.
` in million
Sr.
no.
Particulars Retail
banking
Wholesale
banking
Treasury Other
banking
business
Life
insurance
General
insurance
Others Inter-
segment
adjustments
Total
1
Revenue 225,856.3 313,687.6 355,981.5 28,346.2 173,760.3 50,433.0 29,968.0 (435,988.9) 742,044.0
2
Segment results 9,545.5 66,188.6 36,613.3 6,410.1 15,696.5 2,816.8 7,817.3 (8,920.5) 136,167.6
3
Unallocated expenses —
4
Operating profit (2) – (3) 136,167.6
5
Income tax expenses (net)/
(net deferred tax credit)
34,868.8
6
Net profit1 (4) – (5) 101,298.8
Other information
7
Segment assets 729,750.3 2,269,628.7 2,275,315.5 528,156.9 751,970.8 115,962.4 191,259.5 (182,506.0) 6,679,538.1
8
Unallocated assets268,679.0
9
Total assets (7) + (8) 6,748,217.1
10
Segment liabilities 2,043,187.5 1,071,994.1 2,244,231.83504,637.53753,500.53118,686.93194,484.83 (182,506.0) 6,748,217.1
11
Unallocated liabilities —
12
Total liabilities (10) + (11) 6,748,217.1
13
Capital expenditure 4,426.2 1,188.2 10.8 148.6 319.7 380.0 873.9 (187.6) 7,159.8
14
Depreciation 3,540.8 991.8 18.4 486.6 409.8 488.0 345.2 (25.8) 6,254.8
1. Includes share of net profit of minority shareholders.
2. Includes tax paid in advance/tax deducted at source (net), deferred tax asset (net).
3. Includes share capital and reserves and surplus.