ICICI Bank 2014 Annual Report Download - page 72
Download and view the complete annual report
Please find page 72 of the 2014 ICICI Bank annual report below. You can navigate through the pages in the report by either clicking on the pages listed below, or by using the keyword search tool below to find specific information within the annual report.-
 1
1 -
2
-
3
-
4
-
5
-
6
-
7
-
8
-
9
-
10
-
11
-
12
-
13
-
14
-
15
-
16
-
17
-
18
-
19
-
20
-
21
-
22
-
23
-
24
-
25
-
26
-
27
-
28
-
29
-
30
-
31
-
32
-
33
-
34
-
35
-
36
-
37
-
38
-
39
-
40
-
41
-
42
-
43
-
44
-
45
-
46
-
47
-
48
-
49
-
50
-
51
-
52
-
53
-
54
-
55
-
56
-
57
-
58
-
59
-
60
-
61
-
 62
62 -
 63
63 -
 64
64 -
 65
65 -
 66
66 -
 67
67 -
 68
68 -
 69
69 -
 70
70 -
 71
71 -
 72
72 -
 73
73 -
 74
74 -
 75
75 -
 76
76 -
 77
77 -
 78
78 -
 79
79 -
 80
80 -
 81
81 -
 82
82 -
83
-
84
-
85
-
86
-
87
-
88
-
89
-
90
-
91
-
92
-
93
-
94
-
95
-
96
-
97
-
98
-
99
-
100
-
101
-
102
-
103
-
104
-
105
-
106
-
107
-
108
-
109
-
110
-
111
-
112
-
113
-
114
-
115
-
116
-
117
-
118
-
119
-
120
-
121
-
122
-
123
-
124
-
125
-
126
-
127
-
128
-
129
-
130
-
131
-
132
-
133
-
134
-
135
-
136
-
137
-
138
-
139
-
140
-
141
-
142
-
143
-
144
-
145
-
146
-
147
-
148
-
149
-
150
-
151
-
152
-
153
-
154
-
155
-
156
-
157
-
158
-
159
-
160
-
161
-
162
-
163
-
164
-
165
-
166
-
167
-
168
-
169
-
170
-
171
-
172
-
173
-
174
-
175
-
176
-
177
-
178
-
179
-
180
-
181
-
182
-
183
-
184
-
185
-
186
-
187
-
188
-
189
-
190
-
191
-
192
-
193
-
194
-
195
-
196
 |
 |
Management’s Discussion & Analysis
70
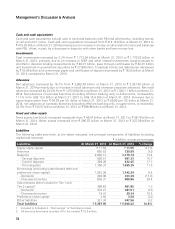
Payments to and provisions for employees
Employee expenses increased by 8.4% from ` 38.93 billion in fiscal 2013 to ` 42.20 billion in fiscal 2014.
Employee expenses increased due to annual increments and increase in the number of employees offset,
in part, by a decrease in provisions for retirement benefit obligations due to an increase in the discount
rate, which is linked to the yield on government securities. The number of employees increased from
62,065 at March 31, 2013 to 72,226 at March 31, 2014. The employee base includes sales executives,
employees on fixed term contracts and interns.
Depreciation
Depreciation on owned property increased by 19.0% from ` 4.57 billion in fiscal 2013 to ` 5.44 billion in
fiscal 2014 due to increase in fixed assets. Depreciation on leased assets decreased from ` 0.33 billion in
fiscal 2013 to ` 0.32 billion in fiscal 2014.
Other administrative expenses
Other administrative expenses primarily include rent, taxes and lighting, advertisement and publicity,
repairs and maintenance and other expenditure. Other administrative expenses increased by 19.1% from
` 46.30 billion in fiscal 2013 to ` 55.13 billion in fiscal 2014. The increase in other administrative expenses
was primarily due to increase in our branch and ATM network and retail business volume. The number of
branches and extension counters (excluding foreign branches and offshore banking units) increased from
3,100 at March 31, 2013 to 3,753 at March 31, 2014. ATM network of the Bank increased from 10,481
ATMs at March 31, 2013 to 11,315 ATMs at March 31, 2014.
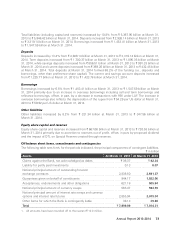
Provisions and contingencies (excluding provisions for tax)
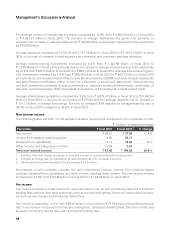
The following tables set forth, for the periods indicated, the components of provisions and contingencies.
` in billion, except percentages
Particulars Fiscal 2013 Fiscal 2014 % change
Provision for investments (including credit substitutes) (net) ` 1.26 ` 0.71 (43.7)%
Provision for non-performing and other assets113.95 22.52 61.4
Provision for standard assets 1.44 2.49 72.9
Others 1.38 0.54 (60.9)
Total provisions and contingencies
(excluding provisions for tax) ` 18.03 ` 26.26 45.6%
1. Includes restructuring related provision.
2. All amounts have been rounded off to the nearest ` 10.0 million.
Provisions are made by the Bank on standard, sub-standard and doubtful assets at rates prescribed
by RBI. Loss assets and unsecured portions of doubtful assets are provided/written off as required by
extant RBI guidelines. Provisions on retail non-performing loans were made at the borrower level in
accordance with the retail assets provisioning policy of the Bank, subject to the minimum provisioning
levels prescribed by RBI. The specific provisions on retail loans held by the Bank were higher than the
minimum regulatory requirement. In addition to the specific provision on NPAs, the Bank maintains a
general provision on performing loans and advances at rates prescribed by RBI. For performing loans
and advances in overseas branches, the general provision is made at higher of host country regulations
requirement and RBI requirement.
Provisions and contingencies (excluding provisions for tax) increased by 45.6% from ` 18.03 billion in
fiscal 2013 to ` 26.26 billion in fiscal 2014 primarily due to increase in provision for non-performing assets
and standard assets. Provision for non-performing assets increased from ` 13.95 billion in fiscal 2013 to
` 22.52 billion in fiscal 2014 primarily due to increase in additions to NPAs and restructured loans in the
SME and corporate portfolio, resulting in a higher provision requirement.
Management’s Discussion & Analysis