ICICI Bank 2014 Annual Report Download - page 111
Download and view the complete annual report
Please find page 111 of the 2014 ICICI Bank annual report below. You can navigate through the pages in the report by either clicking on the pages listed below, or by using the keyword search tool below to find specific information within the annual report.-
 1
1 -
2
-
3
-
4
-
5
-
6
-
7
-
8
-
9
-
10
-
11
-
12
-
13
-
14
-
15
-
16
-
17
-
18
-
19
-
20
-
21
-
22
-
23
-
24
-
25
-
26
-
27
-
28
-
29
-
30
-
31
-
32
-
33
-
34
-
35
-
36
-
37
-
38
-
39
-
40
-
41
-
42
-
43
-
44
-
45
-
46
-
47
-
48
-
49
-
50
-
51
-
52
-
53
-
54
-
55
-
56
-
57
-
58
-
59
-
60
-
61
-
62
-
63
-
64
-
65
-
66
-
67
-
68
-
69
-
70
-
71
-
72
-
73
-
74
-
75
-
76
-
77
-
78
-
79
-
80
-
81
-
82
-
83
-
84
-
85
-
86
-
87
-
88
-
89
-
90
-
91
-
92
-
93
-
94
-
95
-
96
-
97
-
98
-
99
-
100
-
 101
101 -
 102
102 -
 103
103 -
 104
104 -
 105
105 -
 106
106 -
 107
107 -
 108
108 -
 109
109 -
 110
110 -
 111
111 -
 112
112 -
 113
113 -
 114
114 -
 115
115 -
 116
116 -
 117
117 -
 118
118 -
 119
119 -
 120
120 -
 121
121 -
122
-
123
-
124
-
125
-
126
-
127
-
128
-
129
-
130
-
131
-
132
-
133
-
134
-
135
-
136
-
137
-
138
-
139
-
140
-
141
-
142
-
143
-
144
-
145
-
146
-
147
-
148
-
149
-
150
-
151
-
152
-
153
-
154
-
155
-
156
-
157
-
158
-
159
-
160
-
161
-
162
-
163
-
164
-
165
-
166
-
167
-
168
-
169
-
170
-
171
-
172
-
173
-
174
-
175
-
176
-
177
-
178
-
179
-
180
-
181
-
182
-
183
-
184
-
185
-
186
-
187
-
188
-
189
-
190
-
191
-
192
-
193
-
194
-
195
-
196
 |
 |

F23
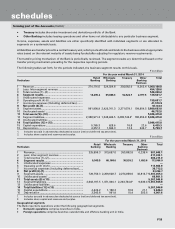
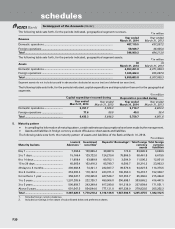
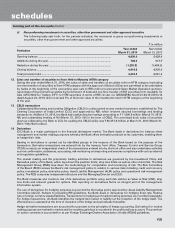
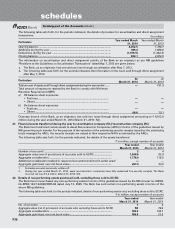
9. Repurchase transactions
The following tables set forth for the periods indicated, the details of securities sold and purchased under repo and
reverse repo transactions respectively including transactions under Liquidity Adjustment Facility (LAF) and Marginal
Standing Facility (MSF).
` in million
Minimum
outstanding
balance
during the
Maximum
outstanding
balance
during the
Daily average
outstanding
balance
during the
Outstanding
balance at
March 31,
2014
Year ended March 31, 2014
Securities sold under Repo, LAF and MSF
i) Government Securities ........................................ 5,003.7 199,735.6 84,099.8 71,810.8
ii) Corporate Debt Securities .................................... — 550.0 3.2 —
Securities purchased under Reverse Repo and LAF
i) Government Securities ........................................ 43.3 50,227.0 5,978.8 29,955.9
ii) Corporate Debt Securities .................................... — 1,050.0 6.2 —
1. Amounts reported are based on face value of securities under repo, reverse repo, LAF and MSF.
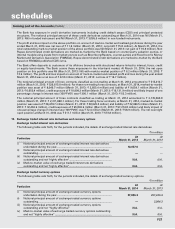
` in million
Minimum
outstanding
balance
during the
Maximum
outstanding
balance
during the
Daily average
outstanding
balance
during the
Outstanding
balance at
March 31,
2013
Year ended March 31, 2013
Securities sold under Repo and LAF
i) Government Securities ........................................ 1.1 189,003.7 93,603.4 150,003.7
ii) Corporate Debt Securities .................................... — — — —
Securities purchased under Reverse Repo and LAF
i) Government Securities ........................................ — 50,211.3 4,475.4 50,211.3
ii) Corporate Debt Securities .................................... — — — —
1. Amounts reported are based on face value of securities under repo, reverse repo and LAF.
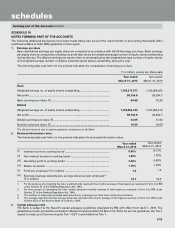
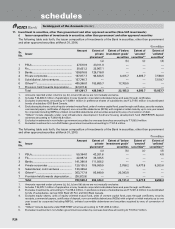
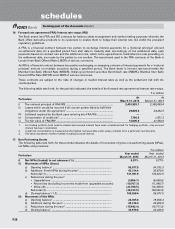
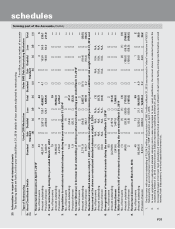
10. Investments
The following table sets forth, for the periods indicated, the details of investments and the movement of provision held
towards depreciation on investments of the Bank.
` in million
Particulars At
March 31, 2014
At
March 31, 2013
1. Value of Investments
(i) Gross value of investments
a) In India .................................................................................................... 1,719,617.3 1,663,577.2
b) Outside India ........................................................................................... 74,375.9 77,981.8
(ii) Provision for depreciation
a) In India .................................................................................................... 23,456.2 (27,378.2)
b) Outside India ........................................................................................... 318.8 (244.8)
(iii) Net value of investments
a) In India .................................................................................................... 1,696,161.1 1,636,199.0
b) Outside India ........................................................................................... 74,057.1 77,737.0
2. Movement of provisions held towards depreciation on investments
(i) Opening balance ........................................................................................... 27,623.0 26,003.2
(ii) Add: Provisions made during the year ........................................................ 1,112.8 1,925.3
(iii) Less: Write-off/(write back) of excess provisions during the year .............. (4,960.8) (305.5)
(iv) Closing balance ............................................................................................. 23,775.0 27,623.0
RBI has as an one time measure permitted the banks to transfer Statutory Liquidity Ratio (SLR) securities from AFS/
HFT category to ‘Held to Maturity’ (HTM) category. Accordingly, during the year ended March 31, 2014, the Bank has
transferred SLR securities of ` 23,285.4 million from AFS/HFT category to HTM category. The Bank has booked a loss of
` 102.4 million on the transfer of such securities.
forming part of the Accounts (Contd.)
schedules