ICICI Bank 2014 Annual Report Download - page 172
Download and view the complete annual report
Please find page 172 of the 2014 ICICI Bank annual report below. You can navigate through the pages in the report by either clicking on the pages listed below, or by using the keyword search tool below to find specific information within the annual report.-
 1
1 -
2
-
3
-
4
-
5
-
6
-
7
-
8
-
9
-
10
-
11
-
12
-
13
-
14
-
15
-
16
-
17
-
18
-
19
-
20
-
21
-
22
-
23
-
24
-
25
-
26
-
27
-
28
-
29
-
30
-
31
-
32
-
33
-
34
-
35
-
36
-
37
-
38
-
39
-
40
-
41
-
42
-
43
-
44
-
45
-
46
-
47
-
48
-
49
-
50
-
51
-
52
-
53
-
54
-
55
-
56
-
57
-
58
-
59
-
60
-
61
-
62
-
63
-
64
-
65
-
66
-
67
-
68
-
69
-
70
-
71
-
72
-
73
-
74
-
75
-
76
-
77
-
78
-
79
-
80
-
81
-
82
-
83
-
84
-
85
-
86
-
87
-
88
-
89
-
90
-
91
-
92
-
93
-
94
-
95
-
96
-
97
-
98
-
99
-
100
-
101
-
102
-
103
-
104
-
105
-
106
-
107
-
108
-
109
-
110
-
111
-
112
-
113
-
114
-
115
-
116
-
117
-
118
-
119
-
120
-
121
-
122
-
123
-
124
-
125
-
126
-
127
-
128
-
129
-
130
-
131
-
132
-
133
-
134
-
135
-
136
-
137
-
138
-
139
-
140
-
141
-
142
-
143
-
144
-
145
-
146
-
147
-
148
-
149
-
150
-
151
-
152
-
153
-
154
-
155
-
156
-
157
-
158
-
159
-
160
-
161
-
 162
162 -
 163
163 -
 164
164 -
 165
165 -
 166
166 -
 167
167 -
 168
168 -
 169
169 -
 170
170 -
 171
171 -
 172
172 -
 173
173 -
 174
174 -
 175
175 -
 176
176 -
 177
177 -
 178
178 -
 179
179 -
 180
180 -
 181
181 -
 182
182 -
183
-
184
-
185
-
186
-
187
-
188
-
189
-
190
-
191
-
192
-
193
-
194
-
195
-
196
 |
 |

F84
forming part of the Consolidated Accounts (Contd.)
schedules
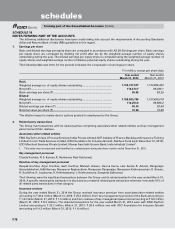
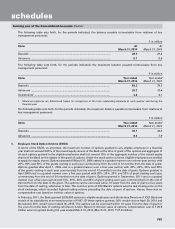
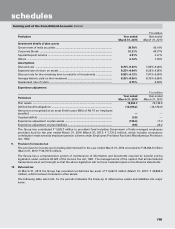
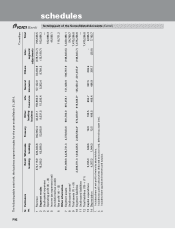
The following table sets forth, for the periods indicated, a summary of the status of the stock option plan of ICICI
Lombard General Insurance Company.
`, except number of options
Stock options outstanding
Year ended March 31, 2014 Year ended March 31, 2013
Particulars
Number of
shares
Weighted
Average
Exercise Price
Number of
shares
Weighted
Average
Exercise Price
Outstanding at the beginning of the year ...................... 11,097,924 100.35 12,449,262 99.33
Add: Granted during the year ......................................... — — — —
Less: Forfeited/lapsed during the year ........................... 318,750 111.71 854,912 118.57
Less: Exercised during the year ..................................... 934,680 43.40 496,426 43.68
Outstanding at the end of the year ................................. 9,844,494 105.39 11,097,924 100.35
Options exercisable ......................................................... 9,153,684 105.26 9,235,704 98.95
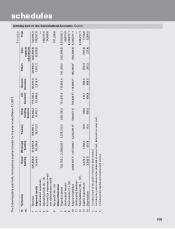
The following table sets forth, summary of stock options outstanding of ICICI Lombard General Insurance Company at
March 31, 2014.
Range of exercise price
(` per share)
Number of shares
arising out of
options
(Number of shares)
Weighted average
exercise price
(` per share)
Weighted average
remaining
contractual life
(Number of years)
35-200 9,844,494 105.39 3.96
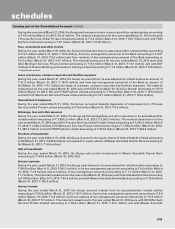
If the Group had used the fair value of options based on the binomial tree model, the compensation cost for the year
ended March 31, 2014 would have been higher by ` 2,273.0 million (March 31, 2013: ` 1,795.5 million) and the proforma
consolidated profit after tax would have been ` 108.14 billion (March 31, 2013: ` 94.24 billion). On a proforma basis,
the Group’s basic earnings per share would have been ` 93.68 (March 31, 2013: ` 81.73) and diluted earnings per share
would have been ` 93.18 (March 31, 2013: ` 81.29).
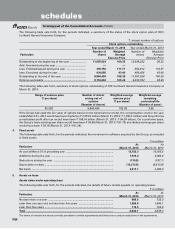
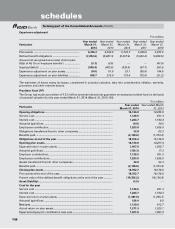
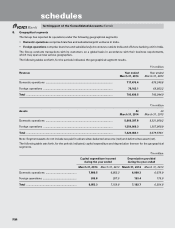
4. Fixed assets
The following table sets forth, for the periods indicated, the movement in software acquired by the Group, as included
in fixed assets.
` in million
Particulars At
March 31, 2014
At
March 31, 2013
At cost at March 31 of preceding year ................................................................ 12,102.3 10,166.5
Additions during the year .................................................................................... 1,533.2 2,092.9
Deductions during the year ................................................................................. (110.5) (157.1)
Depreciation to date ............................................................................................. (10,213.9) (8,813.9)
Net block ............................................................................................................... 3,311.1 3,288.4
5. Assets on lease
Assets taken under operating lease
The following table sets forth, for the periods indicated, the details of future rentals payable on operating leases.
` in million
Particulars At
March 31, 2014
At
March 31, 2013
Not later than one year ........................................................................................ 666.6 732.3
Later than one year and not later than five years ............................................... 1,260.0 1,940.1
Later than five years ............................................................................................. 115.5 165.9
Total ...................................................................................................................... 2,042.1 2,838.3
The terms of renewal are those normally prevalent in similar agreements and there are no undue restrictions in the agreements.