ICICI Bank 2014 Annual Report Download - page 67
Download and view the complete annual report
Please find page 67 of the 2014 ICICI Bank annual report below. You can navigate through the pages in the report by either clicking on the pages listed below, or by using the keyword search tool below to find specific information within the annual report.-
 1
1 -
2
-
3
-
4
-
5
-
6
-
7
-
8
-
9
-
10
-
11
-
12
-
13
-
14
-
15
-
16
-
17
-
18
-
19
-
20
-
21
-
22
-
23
-
24
-
25
-
26
-
27
-
28
-
29
-
30
-
31
-
32
-
33
-
34
-
35
-
36
-
37
-
38
-
39
-
40
-
41
-
42
-
43
-
44
-
45
-
46
-
47
-
48
-
49
-
50
-
51
-
52
-
53
-
54
-
55
-
56
-
 57
57 -
 58
58 -
 59
59 -
 60
60 -
 61
61 -
 62
62 -
 63
63 -
 64
64 -
 65
65 -
 66
66 -
 67
67 -
 68
68 -
 69
69 -
 70
70 -
 71
71 -
 72
72 -
 73
73 -
 74
74 -
 75
75 -
 76
76 -
 77
77 -
78
-
79
-
80
-
81
-
82
-
83
-
84
-
85
-
86
-
87
-
88
-
89
-
90
-
91
-
92
-
93
-
94
-
95
-
96
-
97
-
98
-
99
-
100
-
101
-
102
-
103
-
104
-
105
-
106
-
107
-
108
-
109
-
110
-
111
-
112
-
113
-
114
-
115
-
116
-
117
-
118
-
119
-
120
-
121
-
122
-
123
-
124
-
125
-
126
-
127
-
128
-
129
-
130
-
131
-
132
-
133
-
134
-
135
-
136
-
137
-
138
-
139
-
140
-
141
-
142
-
143
-
144
-
145
-
146
-
147
-
148
-
149
-
150
-
151
-
152
-
153
-
154
-
155
-
156
-
157
-
158
-
159
-
160
-
161
-
162
-
163
-
164
-
165
-
166
-
167
-
168
-
169
-
170
-
171
-
172
-
173
-
174
-
175
-
176
-
177
-
178
-
179
-
180
-
181
-
182
-
183
-
184
-
185
-
186
-
187
-
188
-
189
-
190
-
191
-
192
-
193
-
194
-
195
-
196
 |
 |

Annual Report 2013-2014 65
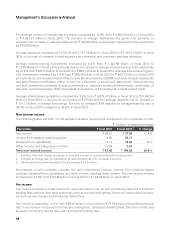
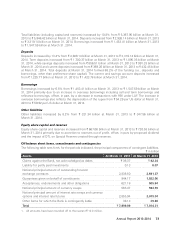
Operating results data
The following table sets forth, for the periods indicated, the operating results data.
` in billion, except percentages
Particulars Fiscal 2013 Fiscal 2014 % change
Interest income ` 400.75 ` 441.78 10.2%
Interest expense 262.09 277.03 5.7
Net interest income 138.66 164.75 18.8
Non-interest income
- Fee income169.01 77.58 12.4
- Treasury income 4.95 10.17 0.0
- Dividend from subsidiaries 9.12 12.96 42.1
- Other income (including lease income)20.38 3.57 —
Operating income 222.12 269.03 21.1
Operating expenses 90.13 103.09 14.4
Operating profit 131.99 165.94 25.7
Provisions, net of write-backs 18.03 26.26 45.6
Profit before tax 113.96 139.68 22.6
Tax, including deferred tax 30.71 41.58 35.4
Profit after tax ` 83.25 ` 98.10 17.8%
1. Includes merchant foreign exchange income and margin on customer derivative transactions.
2. Includes exchange gain on repatriation of retained earnings from overseas branches.
3. All amounts have been rounded off to the nearest ` 10.0 million.
4. Prior period figures have been re-grouped/re-arranged, where necessary.
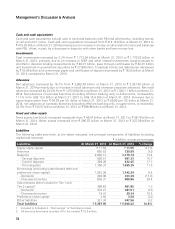
Key ratios
The following table sets forth, for the periods indicated, the key financial ratios.
Particulars Fiscal 2013 Fiscal 2014
Return on average equity (%)112.94 13.73
Return on average assets (%)21.66 1.76
Earnings per share (`) 72.20 84.99
Book value per share (`) 578.25 633.98
Fee to income (%) 31.11 28.87
Cost to income (%)340.49 38.25
1. Return on average equity is the ratio of the net profit after tax to the quarterly average equity share capital and
reserves.
2. Return on average assets is the ratio of net profit after tax to average assets. The average balances are the
averages of daily balances, except averages of foreign branches which are calculated on a fortnightly basis.
3. Cost represents operating expense excluding lease depreciation. Income represents net interest income and
non-interest income and is net of lease depreciation.