ICICI Bank 2014 Annual Report Download - page 75
Download and view the complete annual report
Please find page 75 of the 2014 ICICI Bank annual report below. You can navigate through the pages in the report by either clicking on the pages listed below, or by using the keyword search tool below to find specific information within the annual report.-
 1
1 -
2
-
3
-
4
-
5
-
6
-
7
-
8
-
9
-
10
-
11
-
12
-
13
-
14
-
15
-
16
-
17
-
18
-
19
-
20
-
21
-
22
-
23
-
24
-
25
-
26
-
27
-
28
-
29
-
30
-
31
-
32
-
33
-
34
-
35
-
36
-
37
-
38
-
39
-
40
-
41
-
42
-
43
-
44
-
45
-
46
-
47
-
48
-
49
-
50
-
51
-
52
-
53
-
54
-
55
-
56
-
57
-
58
-
59
-
60
-
61
-
62
-
63
-
64
-
 65
65 -
 66
66 -
 67
67 -
 68
68 -
 69
69 -
 70
70 -
 71
71 -
 72
72 -
 73
73 -
 74
74 -
 75
75 -
 76
76 -
 77
77 -
 78
78 -
 79
79 -
 80
80 -
 81
81 -
 82
82 -
 83
83 -
 84
84 -
 85
85 -
86
-
87
-
88
-
89
-
90
-
91
-
92
-
93
-
94
-
95
-
96
-
97
-
98
-
99
-
100
-
101
-
102
-
103
-
104
-
105
-
106
-
107
-
108
-
109
-
110
-
111
-
112
-
113
-
114
-
115
-
116
-
117
-
118
-
119
-
120
-
121
-
122
-
123
-
124
-
125
-
126
-
127
-
128
-
129
-
130
-
131
-
132
-
133
-
134
-
135
-
136
-
137
-
138
-
139
-
140
-
141
-
142
-
143
-
144
-
145
-
146
-
147
-
148
-
149
-
150
-
151
-
152
-
153
-
154
-
155
-
156
-
157
-
158
-
159
-
160
-
161
-
162
-
163
-
164
-
165
-
166
-
167
-
168
-
169
-
170
-
171
-
172
-
173
-
174
-
175
-
176
-
177
-
178
-
179
-
180
-
181
-
182
-
183
-
184
-
185
-
186
-
187
-
188
-
189
-
190
-
191
-
192
-
193
-
194
-
195
-
196
 |
 |

Annual Report 2013-2014 73
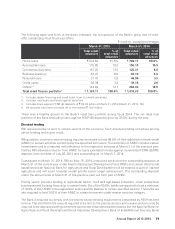
Total liabilities (including capital and reserves) increased by 10.8% from ` 5,367.95 billion at March 31,
2013 to ` 5,946.42 billion at March 31, 2014. Deposits increased from ` 2,926.14 billion at March 31, 2013
to ` 3,319.14 billion at March 31, 2014. Borrowings increased from ` 1,453.41 billion at March 31, 2013
to ` 1,547.59 billion at March 31, 2014.
Deposits
Deposits increased by 13.4% from ` 2,926.14 billion at March 31, 2013 to ` 3,319.14 billion at March 31,
2014. Term deposits increased from ` 1,700.37 billion at March 31, 2013 to ` 1,895.35 billion at March
31, 2014, while savings deposits increased from ` 856.51 billion at March 31, 2013 to ` 991.33 billion at
March 31, 2014 and current deposits increased from ` 369.26 billion at March 31, 2013 to ` 432.45 billion
at March 31, 2014. Total deposits at March 31, 2014 formed 68.2% of the funding (i.e., deposits and
borrowings, other than preference share capital). The current and savings account deposits increased
from ` 1,225.77 billion at March 31, 2013 to ` 1,423.78 billion at March 31, 2014.
Borrowings
Borrowings increased by 6.5% from ` 1,453.41 billion at March 31, 2013 to ` 1,547.59 billion at March
31, 2014 primarily due to an increase in overseas borrowings including call and term borrowings and
refinance borrowings, offset, in part, by a decrease in transactions with RBI under LAF. The increase in
overseas borrowings also reflects the depreciation of the rupee from ` 54.29 per US dollar at March 31,
2013 to ` 59.92 per US dollar at March 31, 2014.
Other liabilities
Other liabilities increased by 8.2% from ` 321.34 billion at March 31, 2013 to ` 347.56 billion at
March 31, 2014.
Equity share capital and reserves
Equity share capital and reserves increased from ` 667.06 billion at March 31, 2013 to ` 720.58 billion at
March 31, 2014 primarily due to accretion to reserves out of profit, offset, in part, by proposed dividend
and the impact of DTL on Special Reserve created through reserves.
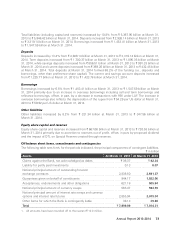
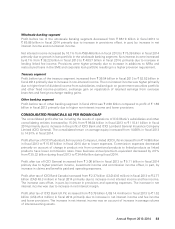
Off balance sheet items, commitments and contingencies
The following table sets forth, for the periods indicated, the principal components of contingent liabilities.
` in billion
Assets At March 31, 2013 At March 31, 2014
Claims against the Bank, not acknowledged as debts ` 36.37 ` 42.24
Liability for partly paid investments 0.13 0.07
Notional principal amount of outstanding forward
exchange contracts 2,838.50 2,691.37
Guarantees given on behalf of constituents 944.17 1,022.06
Acceptances, endorsements and other obligations 621.18 505.54
Notional principal amount of currency swaps 565.47 594.39
Notional principal amount of interest rate swaps and currency
options and interest rate futures 2,855.94 2,919.04
Other items for which the Bank is contingently liable 38.13 39.60
Total ` 7,899.89 ` 7,814.31
1. All amounts have been rounded off to the nearest ` 10.0 million.