ICICI Bank 2014 Annual Report Download - page 117
Download and view the complete annual report
Please find page 117 of the 2014 ICICI Bank annual report below. You can navigate through the pages in the report by either clicking on the pages listed below, or by using the keyword search tool below to find specific information within the annual report.-
 1
1 -
2
-
3
-
4
-
5
-
6
-
7
-
8
-
9
-
10
-
11
-
12
-
13
-
14
-
15
-
16
-
17
-
18
-
19
-
20
-
21
-
22
-
23
-
24
-
25
-
26
-
27
-
28
-
29
-
30
-
31
-
32
-
33
-
34
-
35
-
36
-
37
-
38
-
39
-
40
-
41
-
42
-
43
-
44
-
45
-
46
-
47
-
48
-
49
-
50
-
51
-
52
-
53
-
54
-
55
-
56
-
57
-
58
-
59
-
60
-
61
-
62
-
63
-
64
-
65
-
66
-
67
-
68
-
69
-
70
-
71
-
72
-
73
-
74
-
75
-
76
-
77
-
78
-
79
-
80
-
81
-
82
-
83
-
84
-
85
-
86
-
87
-
88
-
89
-
90
-
91
-
92
-
93
-
94
-
95
-
96
-
97
-
98
-
99
-
100
-
101
-
102
-
103
-
104
-
105
-
106
-
 107
107 -
 108
108 -
 109
109 -
 110
110 -
 111
111 -
 112
112 -
 113
113 -
 114
114 -
 115
115 -
 116
116 -
 117
117 -
 118
118 -
 119
119 -
 120
120 -
 121
121 -
 122
122 -
 123
123 -
 124
124 -
 125
125 -
 126
126 -
 127
127 -
128
-
129
-
130
-
131
-
132
-
133
-
134
-
135
-
136
-
137
-
138
-
139
-
140
-
141
-
142
-
143
-
144
-
145
-
146
-
147
-
148
-
149
-
150
-
151
-
152
-
153
-
154
-
155
-
156
-
157
-
158
-
159
-
160
-
161
-
162
-
163
-
164
-
165
-
166
-
167
-
168
-
169
-
170
-
171
-
172
-
173
-
174
-
175
-
176
-
177
-
178
-
179
-
180
-
181
-
182
-
183
-
184
-
185
-
186
-
187
-
188
-
189
-
190
-
191
-
192
-
193
-
194
-
195
-
196
 |
 |

F29
` in million
Particulars Year ended
March 31, 2014
Year ended
March 31, 2013
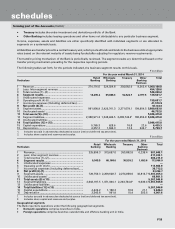
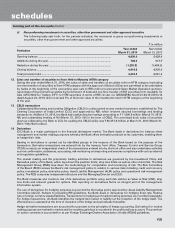
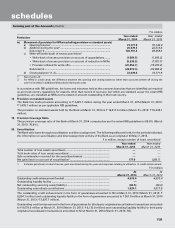
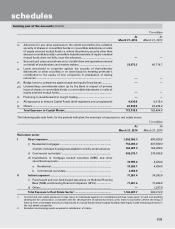
iv) Movement of provision for NPAs (excluding provision on standard assets)
a) Opening balance1 ................................................................................ 73,771.9 76,144.9
b) Addition during the year2 .................................................................... 26,379.3 22,513.4
Sub-total (1) ......................................................................................... 100,151.2 98,658.3
c) Write-off/(write-back) of excess provisions2
•Write-backofexcessprovisiononaccountofupgradations ........ (1,084.5) (1,543.3)
•Write-backofexcessprovisiononaccountofreductioninNPAs (5,333.2) (7,072.7)
•Provisionutilisedforwrite-offs ....................................................... (21,654.7) (16,270.4)
Sub-total (2) ......................................................................................... (28,072.4) (24,886.4)
d) Closing balance1 (1-2) .......................................................................... 72,078.8 73,771.9
1. Net of write-off.
2. For NPAs in credit cards, the difference between the opening and closing balances (other than accounts written off during the
year) is included in additions/(reductions) during the year.
In accordance with RBI guidelines, the loans and advances held at the overseas branches that are identified as impaired
as per host country regulations for reasons other than record of recovery, but which are standard as per the extant RBI
guidelines, are classified as NPAs to the extent of amount outstanding in the host country.
18. Provision on standard assets
The Bank has made provision amounting to ` 2,487.7 million during the year ended March 31, 2014 (March 31, 2013:
` 1,439.1 million) as per applicable RBI guidelines.
The provision on standard assets held by the Bank at March 31, 2014 is ` 19,317.6 million (March 31, 2013: ` 16,235.1
million).
19. Provision Coverage Ratio
The provision coverage ratio of the Bank at March 31, 2014 computed as per the extant RBI guidelines is 68.6% (March
31, 2013: 76.8%).
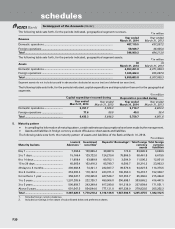
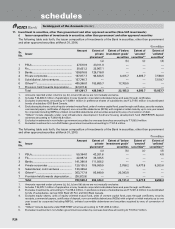
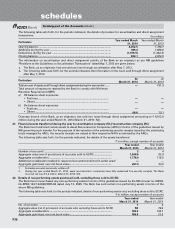
20. Securitisation
The Bank sells loans through securitisation and direct assignment. The following tables set forth, for the periods indicated,
the information on securitisation and direct assignment activity of the Bank as an originator till May 7, 2012.
` in million, except number of loans securitised
Year ended
March 31, 2014
Year ended
March 31, 2013
Total number of loan assets securitised ............................................................. ——
Total book value of loan assets securitised ........................................................ ——
Sale consideration received for the securitised assets ..................................... ——
Net gain/(loss) on account of securitisation1 ...................................................... 177.9 (283.7)
1. Includes gain/(loss) on deal closures, gain amortised during the year and expenses relating to utilisation of credit enhancement.
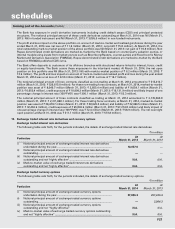
` in million
At
March 31, 2014
At
March 31, 2013
Outstanding credit enhancement (funded) .............................................................. 4,970.4 4,970.4
Outstanding liquidity facility ............................................................................... ——
Net outstanding servicing asset/(liability) .......................................................... (84.5) (88.9)
Outstanding subordinate contributions ............................................................. 1,624.1 3,017.8
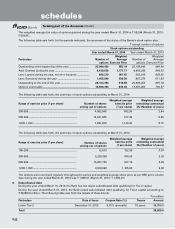
The outstanding credit enhancement in the form of guarantees amounted to Nil at March 31, 2014 (March 31, 2013: `
8,234.1 million) and outstanding liquidity facility in the form of guarantees amounted to ` 261.0 million at March 31, 2014
(March 31, 2013: ` 3,937.7 million).
Outstanding credit enhancement in the form of guarantees for third party originated securitisation transactions amounted
to ` 8,578.8 million at March 31, 2014 (March 31, 2013: ` 8,132.0 million) and outstanding liquidity facility for third party
originated securitisation transactions amounted to Nil at March 31, 2014 (March 31, 2013: Nil).
forming part of the Accounts (Contd.)
schedules