ICICI Bank 2014 Annual Report Download - page 153
Download and view the complete annual report
Please find page 153 of the 2014 ICICI Bank annual report below. You can navigate through the pages in the report by either clicking on the pages listed below, or by using the keyword search tool below to find specific information within the annual report.-
 1
1 -
2
-
3
-
4
-
5
-
6
-
7
-
8
-
9
-
10
-
11
-
12
-
13
-
14
-
15
-
16
-
17
-
18
-
19
-
20
-
21
-
22
-
23
-
24
-
25
-
26
-
27
-
28
-
29
-
30
-
31
-
32
-
33
-
34
-
35
-
36
-
37
-
38
-
39
-
40
-
41
-
42
-
43
-
44
-
45
-
46
-
47
-
48
-
49
-
50
-
51
-
52
-
53
-
54
-
55
-
56
-
57
-
58
-
59
-
60
-
61
-
62
-
63
-
64
-
65
-
66
-
67
-
68
-
69
-
70
-
71
-
72
-
73
-
74
-
75
-
76
-
77
-
78
-
79
-
80
-
81
-
82
-
83
-
84
-
85
-
86
-
87
-
88
-
89
-
90
-
91
-
92
-
93
-
94
-
95
-
96
-
97
-
98
-
99
-
100
-
101
-
102
-
103
-
104
-
105
-
106
-
107
-
108
-
109
-
110
-
111
-
112
-
113
-
114
-
115
-
116
-
117
-
118
-
119
-
120
-
121
-
122
-
123
-
124
-
125
-
126
-
127
-
128
-
129
-
130
-
131
-
132
-
133
-
134
-
135
-
136
-
137
-
138
-
139
-
140
-
141
-
142
-
 143
143 -
 144
144 -
 145
145 -
 146
146 -
 147
147 -
 148
148 -
 149
149 -
 150
150 -
 151
151 -
 152
152 -
 153
153 -
 154
154 -
 155
155 -
 156
156 -
 157
157 -
 158
158 -
 159
159 -
 160
160 -
 161
161 -
 162
162 -
 163
163 -
164
-
165
-
166
-
167
-
168
-
169
-
170
-
171
-
172
-
173
-
174
-
175
-
176
-
177
-
178
-
179
-
180
-
181
-
182
-
183
-
184
-
185
-
186
-
187
-
188
-
189
-
190
-
191
-
192
-
193
-
194
-
195
-
196
 |
 |

F65
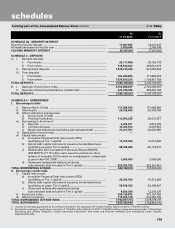
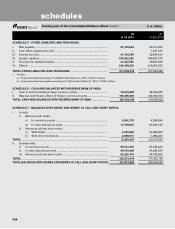
forming part of the Consolidated Balance Sheet (Contd.) (` in ‘000s)
At
31.03.2014
At
31.03.2013
SCHEDULE 8 - INVESTMENTS
I. Investments in India (net of provisions)
i) Government securities ........................................................................ 1,147,471,623 1,097,604,436
ii) Other approved securities .................................................................. — —
iii) Shares (includes equity and preference shares)1 .............................. 55,717,884 51,197,259
iv) Debentures and bonds ........................................................................ 226,406,803 264,433,133
v) Assets held to cover linked liabilities of life insurance business ....... 603,104,321 575,208,274
vi) Others (commercial paper, mutual fund units, pass through
certificates, security receipts, certificate of deposits, Rural
Infrastructure Development Fund deposits and other related
investments) ........................................................................................ 573,456,669 472,423,718
TOTAL INVESTMENTS IN INDIA .......................................................................... 2,606,157,300 2,460,866,820
II. Investments outside India (net of provisions)
i) Government securities ........................................................................ 42,362,035 48,086,185
ii) Others (equity shares, bonds and certificate of deposits) ................. 27,575,072 47,713,781
TOTAL INVESTMENTS OUTSIDE INDIA .............................................................. 69,937,107 95,799,966
TOTAL INVESTMENTS .......................................................................................... 2,676,094,407 2,556,666,786
A. Investments in India
Gross value of investments2 ........................................................................ 2,621,061,870 2,485,525,836
Less: Aggregate of provision/depreciation/(appreciation) ......................... 14,904,570 24,659,016
Net investments ............................................................................................ 2,606,157,300 2,460,866,820
B. Investments outside India
Gross value of investments ......................................................................... 70,663,959 95,528,312
Less: Aggregate of provision/depreciation/(appreciation) ......................... 726,852 (271,654)
Net investments ............................................................................................ 69,937,107 95,799,966
TOTAL INVESTMENTS .......................................................................................... 2,676,094,407 2,556,666,786
1. Includes acquisition cost of investment in associates amounting to ` 1,443.5 million (March 31, 2013: ` 1,443.5 million).
2. Includes net appreciation amounting to ` 68,366.6 million (March 31, 2013: ` 39,321.6 million) on investments held to cover linked liabilities of
life insurance business.
SCHEDULE 9 - ADVANCES (net of provisions)
A. i) Bills purchased and discounted ............................................................ 93,042,405 69,689,970
ii) Cash credits, overdrafts and loans repayable on demand .................. 556,270,075 455,660,112
iii) Term loans ............................................................................................. 3,224,105,326 2,774,391,183
TOTAL ADVANCES ........................................................................................................ 3,873,417,806 3,299,741,265
B. i) Secured by tangible assets (includes advances against book debts) 3,215,667,074 2,777,704,336
ii) Covered by bank/government guarantees ........................................... 41,650,261 22,221,201
iii) Unsecured .............................................................................................. 616,100,471 499,815,728
TOTAL ADVANCES ....................................................................................................... 3,873,417,806 3,299,741,265
C. I. Advances in India
i) Priority sector ........................................................................................ 645,514,532 593,479,333
ii) Public sector .......................................................................................... 27,754,783 13,438,496
iii) Banks ...................................................................................................... 287,641 187,857
iv) Others .................................................................................................... 1,872,438,122 1,613,882,876
TOTAL ADVANCES IN INDIA ........................................................................................ 2,545,995,078 2,220,988,562
II. Advances outside India
i) Due from banks ..................................................................................... 10,859,099 17,492,429
ii) Due from others
a) Bills purchased and discounted ................................................... 37,002,621 21,068,811
b) Syndicated and term loans .......................................................... 974,022,428 885,757,203
c) Others ........................................................................................... 305,538,580 154,434,260
TOTAL ADVANCES OUTSIDE INDIA ............................................................................ 1,327,422,728 1,078,752,703
TOTAL ADVANCES ........................................................................................................ 3,873,417,806 3,299,741,265
schedules