ICICI Bank 2014 Annual Report Download - page 87
Download and view the complete annual report
Please find page 87 of the 2014 ICICI Bank annual report below. You can navigate through the pages in the report by either clicking on the pages listed below, or by using the keyword search tool below to find specific information within the annual report.-
 1
1 -
2
-
3
-
4
-
5
-
6
-
7
-
8
-
9
-
10
-
11
-
12
-
13
-
14
-
15
-
16
-
17
-
18
-
19
-
20
-
21
-
22
-
23
-
24
-
25
-
26
-
27
-
28
-
29
-
30
-
31
-
32
-
33
-
34
-
35
-
36
-
37
-
38
-
39
-
40
-
41
-
42
-
43
-
44
-
45
-
46
-
47
-
48
-
49
-
50
-
51
-
52
-
53
-
54
-
55
-
56
-
57
-
58
-
59
-
60
-
61
-
62
-
63
-
64
-
65
-
66
-
67
-
68
-
69
-
70
-
71
-
72
-
73
-
74
-
75
-
76
-
 77
77 -
 78
78 -
 79
79 -
 80
80 -
 81
81 -
 82
82 -
 83
83 -
 84
84 -
 85
85 -
 86
86 -
 87
87 -
 88
88 -
 89
89 -
 90
90 -
 91
91 -
 92
92 -
 93
93 -
 94
94 -
 95
95 -
 96
96 -
 97
97 -
98
-
99
-
100
-
101
-
102
-
103
-
104
-
105
-
106
-
107
-
108
-
109
-
110
-
111
-
112
-
113
-
114
-
115
-
116
-
117
-
118
-
119
-
120
-
121
-
122
-
123
-
124
-
125
-
126
-
127
-
128
-
129
-
130
-
131
-
132
-
133
-
134
-
135
-
136
-
137
-
138
-
139
-
140
-
141
-
142
-
143
-
144
-
145
-
146
-
147
-
148
-
149
-
150
-
151
-
152
-
153
-
154
-
155
-
156
-
157
-
158
-
159
-
160
-
161
-
162
-
163
-
164
-
165
-
166
-
167
-
168
-
169
-
170
-
171
-
172
-
173
-
174
-
175
-
176
-
177
-
178
-
179
-
180
-
181
-
182
-
183
-
184
-
185
-
186
-
187
-
188
-
189
-
190
-
191
-
192
-
193
-
194
-
195
-
196
 |
 |

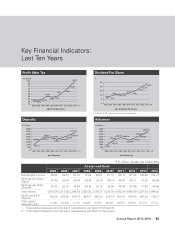
Annual Report 2013-2014 85
Key Financial Indicators:
Last Ten Years
`
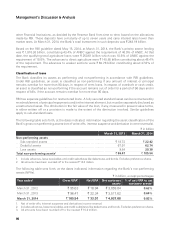
Dividend Per Share
2005 2006 2007 2008 2009 2010 2011 2012 2013 2014 FY
8.50 8.50
10.00
11.00 11.00
12.00
14.00
16.50
20.00
23.00
25
20
15
10
5
0
Dividend Per Share
` in billion, except per share data
At year–end fiscal
2005 2006 2007 2008 2009 2010 2011 2012 2013 2014
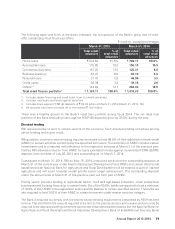
Net interest income 29.32 39.07 56.37 73.04 83.67 81.14 90.17 107.34 138.66 164.75
Earnings per share
(Basic) 27.55 32.49 34.84 39.39 33.76 36.14 45.27 56.11 72.20 84.99
Earnings per share
(Diluted) 27.33 32.15 34.64 39.15 33.70 35.99 45.06 55.95 71.93 84.65
Total assets 1,676.59 2,513.89 3,446.58 3,997.95 3,793.01 3,634.00 4,062.34 4,890.69 5,367.95 5,946.42
Equity capital &
reserves 125.50 222.06 243.13 464.71 495.33 516.18 550.91 604.05 667.06 732.13
Total capital
adequacy ratio 11.8% 13.4% 11.7% 14.0%115.5%119.4%119.5%118.5%118.7%117.7%2
1. Total capital adequacy ratio has been calculated as per Basel II framework.
2. Total capital adequacy ratio has been calculated as per Basel III framework.
For fiscal 2014, represents proposed dividend.
` in billion
100
90
80
70
60
50
40
30
20
10
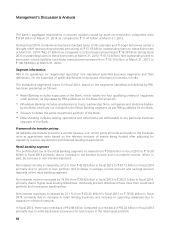
2005 2006 2007 2008 2009 2010 2011 2012 2013 2014 FY
20.05
25.40
31.10
41.58
37.58 40.25
51.51 64.65
83.25
98.10
Profit After Tax
Profit After Tax
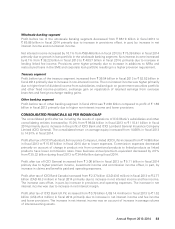
Advances
Advances
4,000
3,500
3,000
2,500
2,000
1,500
1,000
500
02005 2006 2007 2008 2009 2010 2011 2012 2013 2014 FY
` in billion
914.05
1,461.63
1,958.66
2,256.16 2,183.11
2,902.49
3,387.03
1,812.06
2,163.66
2,537.28
Deposits
Deposits
4,000
3,500
3,000
2,500
2,000
1,500
1,000
500
02005 2006 2007 2008 2009 2010 2011 2012 2013 2014 FY
` in billion
998.19
2,305.10
2,020.17 2,256.02
2,555.00
2,926.13
1,650.83
2,444.31 2,183.48
3,319.14