ICICI Bank 2014 Annual Report Download - page 148
Download and view the complete annual report
Please find page 148 of the 2014 ICICI Bank annual report below. You can navigate through the pages in the report by either clicking on the pages listed below, or by using the keyword search tool below to find specific information within the annual report.-
 1
1 -
2
-
3
-
4
-
5
-
6
-
7
-
8
-
9
-
10
-
11
-
12
-
13
-
14
-
15
-
16
-
17
-
18
-
19
-
20
-
21
-
22
-
23
-
24
-
25
-
26
-
27
-
28
-
29
-
30
-
31
-
32
-
33
-
34
-
35
-
36
-
37
-
38
-
39
-
40
-
41
-
42
-
43
-
44
-
45
-
46
-
47
-
48
-
49
-
50
-
51
-
52
-
53
-
54
-
55
-
56
-
57
-
58
-
59
-
60
-
61
-
62
-
63
-
64
-
65
-
66
-
67
-
68
-
69
-
70
-
71
-
72
-
73
-
74
-
75
-
76
-
77
-
78
-
79
-
80
-
81
-
82
-
83
-
84
-
85
-
86
-
87
-
88
-
89
-
90
-
91
-
92
-
93
-
94
-
95
-
96
-
97
-
98
-
99
-
100
-
101
-
102
-
103
-
104
-
105
-
106
-
107
-
108
-
109
-
110
-
111
-
112
-
113
-
114
-
115
-
116
-
117
-
118
-
119
-
120
-
121
-
122
-
123
-
124
-
125
-
126
-
127
-
128
-
129
-
130
-
131
-
132
-
133
-
134
-
135
-
136
-
137
-
 138
138 -
 139
139 -
 140
140 -
 141
141 -
 142
142 -
 143
143 -
 144
144 -
 145
145 -
 146
146 -
 147
147 -
 148
148 -
 149
149 -
 150
150 -
 151
151 -
 152
152 -
 153
153 -
 154
154 -
 155
155 -
 156
156 -
 157
157 -
 158
158 -
159
-
160
-
161
-
162
-
163
-
164
-
165
-
166
-
167
-
168
-
169
-
170
-
171
-
172
-
173
-
174
-
175
-
176
-
177
-
178
-
179
-
180
-
181
-
182
-
183
-
184
-
185
-
186
-
187
-
188
-
189
-
190
-
191
-
192
-
193
-
194
-
195
-
196
 |
 |

F60
for the year ended March 31, 2014 (` in ‘000s)
consolidated cash flow statement
Particulars Year ended
31.03.2014
Year ended
31.03.2013
Cash flow from operating activities
Profit before taxes .......................................................................................... 156,508,688 130,904,932
Adjustments for:
Depreciation and amortisation ..................................................................... 8,418,401 7,309,535
Net (appreciation)/depreciation on investments .......................................... (704,719) 4,964,954
Provision in respect of non-performing and other assets ........................... 24,818,320 15,513,824
Prudential provision for standard assets ...................................................... 1,591,953 1,349,872
Provision for contingencies & others ............................................................ 963,597 2,370,283
(Profit)/loss on sale of fixed assets ................................................................ (1,352,001) (339,276)
Employees stock options grants ................................................................... 120,371 98,647
(i) 190,364,610 162,172,771
Adjustments for:
(Increase)/decrease in investments .............................................................. 49,187,517 53,888,779
(Increase)/decrease in advances ................................................................... (573,005,899) (394,857,560)
Increase/(decrease) in deposits .................................................................... 447,421,466 328,200,621
(Increase)/decrease in other assets .............................................................. (58,988,442) 19,276,308
Increase/(decrease) in other liabilities and provisions ................................. 58,968,410 43,960,881
(ii) (76,416,948) 50,469,029
Refund/(payment) of direct taxes .................................................................. (iii) (46,299,744) (37,702,018)
Net cash flow from operating activities (i)+(ii)+(iii) .................................. (A) 67,647,918 174,939,782
Cash flow from investing activities
Purchase of fixed assets ................................................................................ (8,373,656) (6,249,292)
Proceeds from sale of fixed assets ............................................................... 2,051,182 700,038
(Purchase)/sale of held to maturity securities .............................................. (160,353,177) (185,928,901)
Net cash used in investing activities .......................................................... (B) (166,675,651) (191,478,155)
Cash flow from financing activities
Proceeds from issue of share capital (including ESOPs) ................................. 761,818 447,515
Net proceeds/(repayment) of borrowings .................................................... 105,001,542 114,579,019
Dividend and dividend tax paid .................................................................... (27,040,480) (22,194,629)
Net cash generated from financing activities ............................................. (C) 78,722,880 92,831,905
Effect of exchange fluctuation on translation reserve ............................... (D) 9,178,547 5,852,155
Net increase/(decrease) in cash and cash equivalents (A)+(B)+(C)+(D) . (11,126,306) 82,145,687
Cash and cash equivalents at beginning of the year .................................. 493,708,570 411,562,883
Cash and cash equivalents at end of the year ............................................ 482,582,264 493,708,570
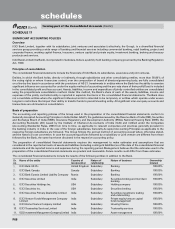
Significant accounting policies and notes to accounts (refer schedule 17 & 18).
Refer Item no. 12 in schedule 17 significant accouting policies.
The Schedules referred to above form an integral part of the Balance Sheet.
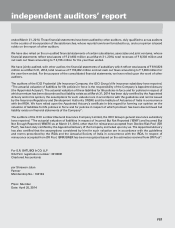
As per our Report of even date. For and on behalf of the Board of Directors
FOR S.R. BATLIBOI & CO. LLP
ICAI Firm Registration no.: 301003E
Chartered Accountants
K. V. KAMATH HOMI KHUSROKHAN CHANDA KOCHHAR
Chairman Director Managing Director & CEO
SHRAWAN JALAN
Partner
Membership no.: 102102
N. S. KANNAN K. RAMKUMAR RAJIV SABHARWAL
Executive Director Executive Director Executive Director
P. S ANKER RAKESH JHA AJAY MITTAL
Place : Mumbai Senior General Manager (Legal)
& Company Secretary
Chief Financial Officer Chief Accountant
Date : April 25, 2014