ICICI Bank 2014 Annual Report Download - page 97
Download and view the complete annual report
Please find page 97 of the 2014 ICICI Bank annual report below. You can navigate through the pages in the report by either clicking on the pages listed below, or by using the keyword search tool below to find specific information within the annual report.-
 1
1 -
2
-
3
-
4
-
5
-
6
-
7
-
8
-
9
-
10
-
11
-
12
-
13
-
14
-
15
-
16
-
17
-
18
-
19
-
20
-
21
-
22
-
23
-
24
-
25
-
26
-
27
-
28
-
29
-
30
-
31
-
32
-
33
-
34
-
35
-
36
-
37
-
38
-
39
-
40
-
41
-
42
-
43
-
44
-
45
-
46
-
47
-
48
-
49
-
50
-
51
-
52
-
53
-
54
-
55
-
56
-
57
-
58
-
59
-
60
-
61
-
62
-
63
-
64
-
65
-
66
-
67
-
68
-
69
-
70
-
71
-
72
-
73
-
74
-
75
-
76
-
77
-
78
-
79
-
80
-
81
-
82
-
83
-
84
-
85
-
86
-
 87
87 -
 88
88 -
 89
89 -
 90
90 -
 91
91 -
 92
92 -
 93
93 -
 94
94 -
 95
95 -
 96
96 -
 97
97 -
 98
98 -
 99
99 -
 100
100 -
 101
101 -
 102
102 -
 103
103 -
 104
104 -
 105
105 -
 106
106 -
 107
107 -
108
-
109
-
110
-
111
-
112
-
113
-
114
-
115
-
116
-
117
-
118
-
119
-
120
-
121
-
122
-
123
-
124
-
125
-
126
-
127
-
128
-
129
-
130
-
131
-
132
-
133
-
134
-
135
-
136
-
137
-
138
-
139
-
140
-
141
-
142
-
143
-
144
-
145
-
146
-
147
-
148
-
149
-
150
-
151
-
152
-
153
-
154
-
155
-
156
-
157
-
158
-
159
-
160
-
161
-
162
-
163
-
164
-
165
-
166
-
167
-
168
-
169
-
170
-
171
-
172
-
173
-
174
-
175
-
176
-
177
-
178
-
179
-
180
-
181
-
182
-
183
-
184
-
185
-
186
-
187
-
188
-
189
-
190
-
191
-
192
-
193
-
194
-
195
-
196
 |
 |

F9
At
31.03.2014
At
31.03.2013
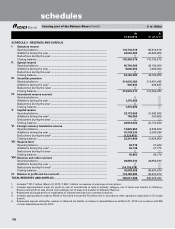
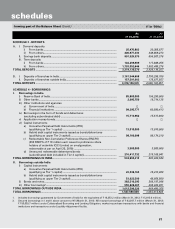
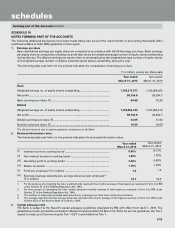
SCHEDULE 8 - INVESTMENTS
I. Investments in India [net of provisions]
i) Government securities ........................................................................................ 951,820,555 923,762,915
ii) Other approved securities ................................................................................... — —
iii) Shares (includes equity and preference shares) ................................................ 24,017,918 25,050,852
iv) Debentures and bonds ........................................................................................ 121,203,629 174,775,171
v) Subsidiaries and/or joint ventures ...................................................................... 65,482,766 65,482,766
vi) Others (commercial paper, mutual fund units, pass through certificates,
security receipts, certificate of deposits, Rural Infrastructure Development
Fund deposits and other related investments) ................................................... 533,636,254 447,127,306
TOTAL INVESTMENTS IN INDIA ...................................................................................... 1,696,161,122 1,636,199,010
II. Investments outside India [net of provisions]
i) Government securities ........................................................................................ 7,095,945 6,574,742
ii) Subsidiaries and/or joint ventures abroad
(includes equity and preference shares) ............................................................ 59,553,372 62,475,493
iii) Others (equity shares, bonds and certificate of deposits) ................................. 7,407,725 8,686,748
TOTAL INVESTMENTS OUTSIDE INDIA .......................................................................... 74,057,042 77,736,983
TOTAL INVESTMENTS ...................................................................................................... 1,770,218,164 1,713,935,993
A. Investments in India
Gross value of investments ....................................................................................... 1,719,617,326 1,663,577,178
Less: Aggregate of provision/depreciation/(appreciation) ....................................... 23,456,204 27,378,168
Net investments.......................................................................................................... 1,696,161,122 1,636,199,010
B. Investments outside India
Gross value of investments ....................................................................................... 74,375,855 77,981,759
Less: Aggregate of provision/depreciation/(appreciation) ....................................... 318,813 244,776
Net investments.......................................................................................................... 74,057,042 77,736,983
TOTAL INVESTMENTS ...................................................................................................... 1,770,218,164 1,713,935,993
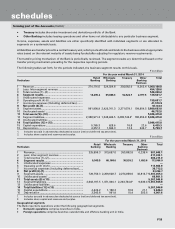
SCHEDULE 9 - ADVANCES [net of provisions]
A. i) Bills purchased and discounted .......................................................................... 83,655,926 61,532,333
ii) Cash credits, overdrafts and loans repayable on demand ................................ 552,132,982 451,092,674
iii) Term loans ............................................................................................................ 2,751,237,584 2,389,869,344
TOTAL ADVANCES ............................................................................................................ 3,387,026,492 2,902,494,351
B. i) Secured by tangible assets (includes advances against book debts) ............... 2,858,197,549 2,471,296,382
ii) Covered by bank/government guarantees ......................................................... 41,650,261 22,221,201
iii) Unsecured ............................................................................................................ 487,178,682 408,976,768
TOTAL ADVANCES ............................................................................................................ 3,387,026,492 2,902,494,351
C. I. Advances in India
i) Priority sector ................................................................................................ 645,517,532 597,940,480
ii) Public sector .................................................................................................. 27,754,783 13,438,496
iii) Banks ............................................................................................................. 287,641 187,857
iv) Others ............................................................................................................ 1,816,506,450 1,557,357,190
TOTAL ADVANCES IN INDIA ............................................................................................ 2,490,066,406 2,168,924,023
II. Advances outside India
i) Due from banks ............................................................................................ 5,935,596 18,107,068
ii) Due from others
a) Bills purchased and discounted ............................................................. 33,737,778 17,437,061
b) Syndicated and term loans ..................................................................... 752,854,831 680,864,553
c) Others ...................................................................................................... 104,431,881 17,161,646
TOTAL ADVANCES OUTSIDE INDIA ................................................................................ 896,960,086 733,570,328
TOTAL ADVANCES ............................................................................................................ 3,387,026,492 2,902,494,351
(` in ‘000s)
forming part of the Balance Sheet (Contd.)
schedules