ICICI Bank 2014 Annual Report Download - page 78
Download and view the complete annual report
Please find page 78 of the 2014 ICICI Bank annual report below. You can navigate through the pages in the report by either clicking on the pages listed below, or by using the keyword search tool below to find specific information within the annual report.-
 1
1 -
2
-
3
-
4
-
5
-
6
-
7
-
8
-
9
-
10
-
11
-
12
-
13
-
14
-
15
-
16
-
17
-
18
-
19
-
20
-
21
-
22
-
23
-
24
-
25
-
26
-
27
-
28
-
29
-
30
-
31
-
32
-
33
-
34
-
35
-
36
-
37
-
38
-
39
-
40
-
41
-
42
-
43
-
44
-
45
-
46
-
47
-
48
-
49
-
50
-
51
-
52
-
53
-
54
-
55
-
56
-
57
-
58
-
59
-
60
-
61
-
62
-
63
-
64
-
65
-
66
-
67
-
 68
68 -
 69
69 -
 70
70 -
 71
71 -
 72
72 -
 73
73 -
 74
74 -
 75
75 -
 76
76 -
 77
77 -
 78
78 -
 79
79 -
 80
80 -
 81
81 -
 82
82 -
 83
83 -
 84
84 -
 85
85 -
 86
86 -
 87
87 -
 88
88 -
89
-
90
-
91
-
92
-
93
-
94
-
95
-
96
-
97
-
98
-
99
-
100
-
101
-
102
-
103
-
104
-
105
-
106
-
107
-
108
-
109
-
110
-
111
-
112
-
113
-
114
-
115
-
116
-
117
-
118
-
119
-
120
-
121
-
122
-
123
-
124
-
125
-
126
-
127
-
128
-
129
-
130
-
131
-
132
-
133
-
134
-
135
-
136
-
137
-
138
-
139
-
140
-
141
-
142
-
143
-
144
-
145
-
146
-
147
-
148
-
149
-
150
-
151
-
152
-
153
-
154
-
155
-
156
-
157
-
158
-
159
-
160
-
161
-
162
-
163
-
164
-
165
-
166
-
167
-
168
-
169
-
170
-
171
-
172
-
173
-
174
-
175
-
176
-
177
-
178
-
179
-
180
-
181
-
182
-
183
-
184
-
185
-
186
-
187
-
188
-
189
-
190
-
191
-
192
-
193
-
194
-
195
-
196
 |
 |
Management’s Discussion & Analysis
76
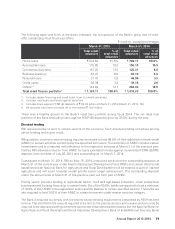
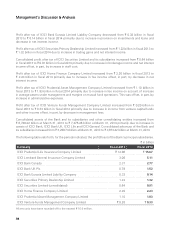
The following section sets forth, a comparative analysis of the capital adequacy position at March 31, 2014 as
compared to March 31, 2013 in accordance with Basel II guidelines of RBI
` in billion, except percentages
Basel II At March 31, 2013 At March 31, 2014
Tier-1 capital ` 565.62 ` 665.40
Tier-2 capital 262.74 264.88
Total capital 828.36 930.28
Credit Risk — RWA 3,894.82 4,333.79
Market Risk — RWA 254.68 232.02
Operational Risk — RWA 269.94 311.16
Total RWA ` 4,419.44 ` 4,876.97
Total capital adequacy ratio 18.74% 19.08%
Tier-1 capital adequacy ratio 12.80% 13.65%
Tier-2 capital adequacy ratio 5.94% 5.43%
1. All amounts have been rounded off to the nearest ` 10.0 million.
Movement in the capital funds and risk weighted assets from March 31, 2013 to March 31, 2014
Capital funds (net of deductions) increased by ` 101.92 billion from ` 828.36 billion at March 31, 2013 to
` 930.28 billion at March 31, 2014 primarily due to accretion to reserves out of profit, decrease in deduction
on account of securitisation and repatriation of capital from overseas banking subsidiary.
Credit risk RWA increased by ` 438.97 billion from ` 3,894.82 billion at March 31, 2013 to ` 4,333.79 billion
at March 31, 2014 due to increase of ` 385.55 billion in RWA for on-balance sheet exposures and increase
of ` 53.42 billion in RWA for off-balance sheet credit exposures.
Market risk RWA decreased by ` 22.66 billion from ` 254.68 billion at March 31, 2013 to ` 232.02 billion
at March 31, 2014 due to decrease in general market risk RWA by ` 25.71 billion (capital charge of ` 2.31
billion), offset, in part, by increase in specific market risk RWA by ` 3.05 billion (capital charge of ` 0.28
billion).
The operational risk RWA at March 31, 2014 was ` 311.16 billion (capital charge of ` 28.00 billion). The
operational risk capital charge is computed based on 15% of average of previous three financial years’
gross income and is revised on an annual basis at June 30.
Internal assessment of capital
The capital management framework of the Bank includes a comprehensive internal capital adequacy
assessment process conducted annually, which determines the adequate level of capitalisation necessary to
meet regulatory norms and current and future business needs, including under stress scenarios. The internal
capital adequacy assessment process is formulated at both standalone bank level and the consolidated group
level. The internal capital adequacy assessment process encompasses capital planning for a four year time
horizon, identification and measurement of material risks and the relationship between risk and capital.
The capital management framework is complemented by the risk management framework, which includes
a comprehensive assessment of material risks. Stress testing, which is a key aspect of the internal capital
adequacy assessment process and the risk management framework, provides an insight on the impact of
Management’s Discussion & Analysis