ICICI Bank 2014 Annual Report Download - page 107
Download and view the complete annual report
Please find page 107 of the 2014 ICICI Bank annual report below. You can navigate through the pages in the report by either clicking on the pages listed below, or by using the keyword search tool below to find specific information within the annual report.-
 1
1 -
2
-
3
-
4
-
5
-
6
-
7
-
8
-
9
-
10
-
11
-
12
-
13
-
14
-
15
-
16
-
17
-
18
-
19
-
20
-
21
-
22
-
23
-
24
-
25
-
26
-
27
-
28
-
29
-
30
-
31
-
32
-
33
-
34
-
35
-
36
-
37
-
38
-
39
-
40
-
41
-
42
-
43
-
44
-
45
-
46
-
47
-
48
-
49
-
50
-
51
-
52
-
53
-
54
-
55
-
56
-
57
-
58
-
59
-
60
-
61
-
62
-
63
-
64
-
65
-
66
-
67
-
68
-
69
-
70
-
71
-
72
-
73
-
74
-
75
-
76
-
77
-
78
-
79
-
80
-
81
-
82
-
83
-
84
-
85
-
86
-
87
-
88
-
89
-
90
-
91
-
92
-
93
-
94
-
95
-
96
-
 97
97 -
 98
98 -
 99
99 -
 100
100 -
 101
101 -
 102
102 -
 103
103 -
 104
104 -
 105
105 -
 106
106 -
 107
107 -
 108
108 -
 109
109 -
 110
110 -
 111
111 -
 112
112 -
 113
113 -
 114
114 -
 115
115 -
 116
116 -
 117
117 -
118
-
119
-
120
-
121
-
122
-
123
-
124
-
125
-
126
-
127
-
128
-
129
-
130
-
131
-
132
-
133
-
134
-
135
-
136
-
137
-
138
-
139
-
140
-
141
-
142
-
143
-
144
-
145
-
146
-
147
-
148
-
149
-
150
-
151
-
152
-
153
-
154
-
155
-
156
-
157
-
158
-
159
-
160
-
161
-
162
-
163
-
164
-
165
-
166
-
167
-
168
-
169
-
170
-
171
-
172
-
173
-
174
-
175
-
176
-
177
-
178
-
179
-
180
-
181
-
182
-
183
-
184
-
185
-
186
-
187
-
188
-
189
-
190
-
191
-
192
-
193
-
194
-
195
-
196
 |
 |

F19
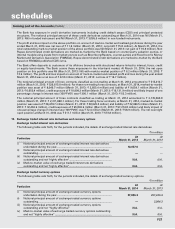
•Treasury includes the entire investment and derivative portfolio of the Bank.
•Other Banking includes leasing operations and other items not attributable to any particular business segment.
Income, expenses, assets and liabilities are either specifically identified with individual segments or are allocated to
segments on a systematic basis.
All liabilities are transfer priced to a central treasury unit, which pools all funds and lends to the business units at appropriate
rates based on the relevant maturity of assets being funded after adjusting for regulatory reserve requirements.
The transfer pricing mechanism of the Bank is periodically reviewed. The segment results are determined based on the
transfer pricing mechanism prevailing for the respective reporting periods.
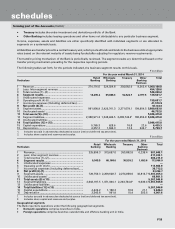
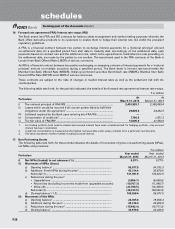
The following tables set forth, for the periods indicated, the business segment results on this basis.
` in million
For the year ended March 31, 2014
Particulars
Retail
Banking
Wholesale
Banking
Treasury Other
Banking
Business
Total
1 Revenue .................................................................. 274,116.0 324,024.8 392,682.6 9,363.4 1,000,186.8
2 Less: Inter-segment revenue ................................. 454,126.6
3 Total revenue (1)–(2) ............................................... 546,060.2
4 Segment results ..................................................... 18,295.2 65,886.3 52,522.7 2,977.5 139,681.7
5 Unallocated expenses ............................................ —
6Operating profit (4)-(5) ............................................. 139,681.7
7Income tax expenses (Including deferred tax) ........ 41,576.9
8 Net profit (6)-(7) ..................................................... 98,104.8
9Segment assets ........................................................ 991,908.9 2,426,741.3 2,371,079.1 109,954.5 5,899,683.8
10 Unallocated assets1 .................................................. 46,732.0
11 Total assets (9)+(10) ............................................... 5,946,415.8
12 Segment liabilities .................................................... 2,388,971.3 1,048,445.5 2,408,745.22100,253.8 5,946,415.8
13 Unallocated liabilities ............................................... —
14 Total liabilities (12)+(13)......................................... 5,946,415.8
15 Capital expenditure .................................................. 5,765.3 628.6 18.8 22.6 6,435.3
16 Depreciation ............................................................. 4,357.2 1,044.3 12.5 345.7 5,759.7
1. Includes tax paid in advance/tax deducted at source (net) and deferred tax asset (net).
2. Includes share capital and reserves and surplus. ` in million
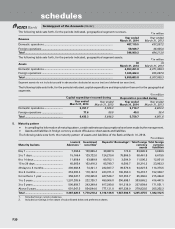
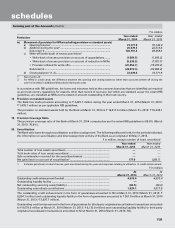
For the year ended March 31, 2013
Particulars
Retail
Banking
Wholesale
Banking
Treasury Other
Banking
Business
Total
1 Revenue .................................................................. 225,856.3 313,687.6 355,862.8 6,238.4 901,645.1
2 Less: Inter-segment revenue ................................. 417,432.1
3 Total revenue (1)–(2) ............................................... 484,213.0
4 Segment results ..................................................... 9,545.5 66,188.6 36,539.2 1,693.6 113,966.9
5 Unallocated expenses ............................................ —
6Operating profit (4)-(5) ............................................. 113,966.9
7 Income tax expenses (Including deferred tax) ...... 30,712.2
8 Net profit (6)-(7) ..................................................... 83,254.7
9 Segment assets ...................................................... 729,750.3 2,269,628.7 2,274,859.6 32,816.7 5,307,055.3
10 Unallocated assets1 ................................................ 60,891.5
11 Total assets (9)+(10) .............................................. 5,367,946.8
12 Segment liabilities .................................................. 2,043,187.5 1,071,994.1 2,243,734.829,030.4 5,367,946.8
13 Unallocated liabilities ............................................. —
14 Total liabilities (12)+(13) ....................................... 5,367,946.8
15 Capital expenditure ................................................ 4,426.2 1,188.2 10.8 21.1 5,646.3
16 Depreciation ........................................................... 3,540.8 991.8 18.4 350.6 4,901.6
1. Includes tax paid in advance/tax deducted at source (net) and deferred tax asset (net).
2. Includes share capital and reserves and surplus.
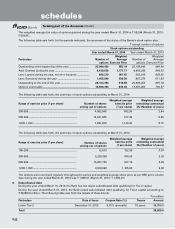
Geographical segments
The Bank reports its operations under the following geographical segments.
•Domestic operations comprise branches in India.
•Foreign operations comprise branches outside India and offshore banking unit in India.
forming part of the Accounts (Contd.)
schedules