ICICI Bank 2014 Annual Report Download - page 106
Download and view the complete annual report
Please find page 106 of the 2014 ICICI Bank annual report below. You can navigate through the pages in the report by either clicking on the pages listed below, or by using the keyword search tool below to find specific information within the annual report.-
 1
1 -
2
-
3
-
4
-
5
-
6
-
7
-
8
-
9
-
10
-
11
-
12
-
13
-
14
-
15
-
16
-
17
-
18
-
19
-
20
-
21
-
22
-
23
-
24
-
25
-
26
-
27
-
28
-
29
-
30
-
31
-
32
-
33
-
34
-
35
-
36
-
37
-
38
-
39
-
40
-
41
-
42
-
43
-
44
-
45
-
46
-
47
-
48
-
49
-
50
-
51
-
52
-
53
-
54
-
55
-
56
-
57
-
58
-
59
-
60
-
61
-
62
-
63
-
64
-
65
-
66
-
67
-
68
-
69
-
70
-
71
-
72
-
73
-
74
-
75
-
76
-
77
-
78
-
79
-
80
-
81
-
82
-
83
-
84
-
85
-
86
-
87
-
88
-
89
-
90
-
91
-
92
-
93
-
94
-
95
-
 96
96 -
 97
97 -
 98
98 -
 99
99 -
 100
100 -
 101
101 -
 102
102 -
 103
103 -
 104
104 -
 105
105 -
 106
106 -
 107
107 -
 108
108 -
 109
109 -
 110
110 -
 111
111 -
 112
112 -
 113
113 -
 114
114 -
 115
115 -
 116
116 -
117
-
118
-
119
-
120
-
121
-
122
-
123
-
124
-
125
-
126
-
127
-
128
-
129
-
130
-
131
-
132
-
133
-
134
-
135
-
136
-
137
-
138
-
139
-
140
-
141
-
142
-
143
-
144
-
145
-
146
-
147
-
148
-
149
-
150
-
151
-
152
-
153
-
154
-
155
-
156
-
157
-
158
-
159
-
160
-
161
-
162
-
163
-
164
-
165
-
166
-
167
-
168
-
169
-
170
-
171
-
172
-
173
-
174
-
175
-
176
-
177
-
178
-
179
-
180
-
181
-
182
-
183
-
184
-
185
-
186
-
187
-
188
-
189
-
190
-
191
-
192
-
193
-
194
-
195
-
196
 |
 |

F18
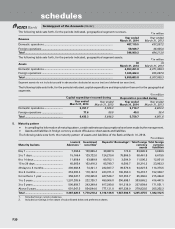
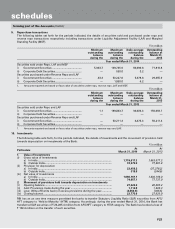
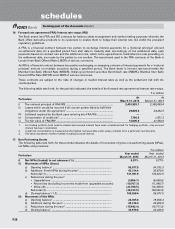
At March 31, 2014, Basel III guidelines require the Bank to maintain a minimum capital to risk-weighted assets ratio
(CRAR) of 9.0% with minimum CET1 of 5.0% and minimum Tier-1 CRAR of 6.5%.
The following table sets forth, for the period indicated, computation of capital adequacy as per Basel III framework.
` in million, except percentages
At
March 31, 2014
Common Equity Tier 1 capital ratio (%) ..................................................................................................... 12.78%
Tier-1 capital ratio (%) ................................................................................................................................... 12.78%
Tier-2 capital ratio (%) ................................................................................................................................... 4.92%
Total Capital ratio (CRAR) (%) ...................................................................................................................... 17.70%
Amount of equity capital raised ................................................................................................................... —
Amount of Additional Tier-1 capital raised; of which
Perpetual Non-Cumulative Preference Shares .......................................................................................
Perpetual Debt Instruments ...................................................................................................................... —
—
Amount of Tier-2 capital raised; of which
Debt capital instrument .............................................................................................................................
Preference Share Capital Instruments .....................................................................................................
[Perpetual Cumulative Preference Shares (PCPS)/Redeemable Non-Cumulative Preference
Shares (RNCPS)/Redeemable Cumulative Preference Shares (RCPS)]
—
—
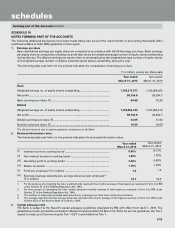
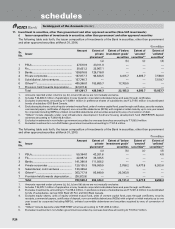
Till March 31, 2013, the Bank was subject to the Basel II capital adequacy guidelines stipulated by RBI with effect from March 31, 2008.
The RBI guidelines on Basel II required the Bank to maintain a minimum CRAR of 9.0% and a minimum Tier-1 CRAR of 6.0% on an
ongoing basis.
The following table sets forth, for the periods indicated, computation of capital adequacy as per Basel II framework.
` in million, except percentages
At
March 31, 2014
At
March 31, 2013
Tier-1 capital ........................................................................................................ 665,400.0 565,615.9
Lower Tier-1 ........................................................................................................ 33,346.2 31,423.0
Tier-2 capital ........................................................................................................ 264,884.5 262,739.2
Upper Tier-2 ......................................................................................................... 152,025.5 146,958.5
Lower Tier-2 subordinated debt ......................................................................... 160,355.5 176,506.1
Total capital .......................................................................................................... 930,284.5 828,355.1
Total risk weighted assets ................................................................................... 4,876,968.1 4,419,435.0
CRAR (%) ............................................................................................................. 19.08% 18.74%
CRAR – Tier-1 capital (%) .................................................................................... 13.65% 12.80%
CRAR – Tier-2 capital (%) .................................................................................... 5.43% 5.94%
Amount raised by issue of Innovative Perpetual Debt Instruments (IPDI) during
the year ................................................................................................................ ——
Amount raised by issue of upper Tier-2 Instruments during the year .............. ——
Amount of subordinated debt raised as Tier-2 capital during the year ............ —38,000.0
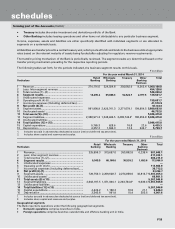
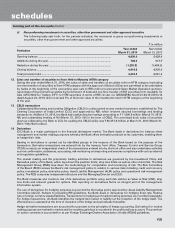
4. Information about business and geographical segments
Business Segments
Pursuant to the guidelines issued by RBI on Accounting Standard 17-(Segment Reporting)- Enhancement of Disclosures
dated April 18, 2007, effective from year ended March 31, 2008, the following business segments have been reported.
•Retail Banking includes exposures which satisfy the four criteria of orientation, product, granularity and low value
of individual exposures for retail exposures laid down in Basel Committee on Banking Supervision document
“International Convergence of Capital Measurement and Capital Standards: A Revised Framework”.
•Wholesale Banking includes all advances to trusts, partnership firms, companies and statutory bodies, which are
not included under Retail Banking.
forming part of the Accounts (Contd.)
schedules