ICICI Bank 2014 Annual Report Download - page 126
Download and view the complete annual report
Please find page 126 of the 2014 ICICI Bank annual report below. You can navigate through the pages in the report by either clicking on the pages listed below, or by using the keyword search tool below to find specific information within the annual report.-
 1
1 -
2
-
3
-
4
-
5
-
6
-
7
-
8
-
9
-
10
-
11
-
12
-
13
-
14
-
15
-
16
-
17
-
18
-
19
-
20
-
21
-
22
-
23
-
24
-
25
-
26
-
27
-
28
-
29
-
30
-
31
-
32
-
33
-
34
-
35
-
36
-
37
-
38
-
39
-
40
-
41
-
42
-
43
-
44
-
45
-
46
-
47
-
48
-
49
-
50
-
51
-
52
-
53
-
54
-
55
-
56
-
57
-
58
-
59
-
60
-
61
-
62
-
63
-
64
-
65
-
66
-
67
-
68
-
69
-
70
-
71
-
72
-
73
-
74
-
75
-
76
-
77
-
78
-
79
-
80
-
81
-
82
-
83
-
84
-
85
-
86
-
87
-
88
-
89
-
90
-
91
-
92
-
93
-
94
-
95
-
96
-
97
-
98
-
99
-
100
-
101
-
102
-
103
-
104
-
105
-
106
-
107
-
108
-
109
-
110
-
111
-
112
-
113
-
114
-
115
-
 116
116 -
 117
117 -
 118
118 -
 119
119 -
 120
120 -
 121
121 -
 122
122 -
 123
123 -
 124
124 -
 125
125 -
 126
126 -
 127
127 -
 128
128 -
 129
129 -
 130
130 -
 131
131 -
 132
132 -
 133
133 -
 134
134 -
 135
135 -
 136
136 -
137
-
138
-
139
-
140
-
141
-
142
-
143
-
144
-
145
-
146
-
147
-
148
-
149
-
150
-
151
-
152
-
153
-
154
-
155
-
156
-
157
-
158
-
159
-
160
-
161
-
162
-
163
-
164
-
165
-
166
-
167
-
168
-
169
-
170
-
171
-
172
-
173
-
174
-
175
-
176
-
177
-
178
-
179
-
180
-
181
-
182
-
183
-
184
-
185
-
186
-
187
-
188
-
189
-
190
-
191
-
192
-
193
-
194
-
195
-
196
 |
 |

F38
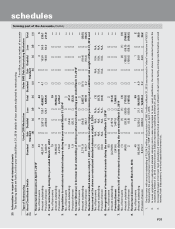
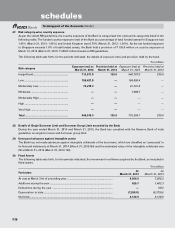
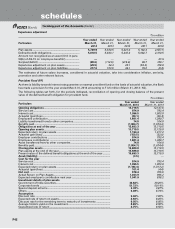
27. Risk category-wise country exposure
As per the extant RBI guidelines, the country exposure of the Bank is categorised into various risk categories listed in the
following table. The funded country exposure (net) of the Bank as a percentage of total funded assets for Singapore was
1.45% (March 31, 2013: 1.45%) and United Kingdom was 0.79% (March 31, 2013: 1.34%). As the net funded exposure
to Singapore exceeds 1.0% of total funded assets, the Bank held a provision of ` 135.0 million on country exposure at
March 31, 2014 (March 31, 2013: ` 230.0 million) based on RBI guidelines.
The following table sets forth, for the periods indicated, the details of exposure (net) and provision held by the bank.
` in million
Risk category Exposure (net) at
March 31, 2014
Provision held at
March 31, 2014
Exposure (net) at
March 31, 2013
Provision held at
March 31, 2013
Insignificant ................................................ 713,811.9 135.0 546,787.0 230.0
Low ............................................................. 158,427.8 — 184,890.4 —
Moderately Low ......................................... 73,278.3 — 41,721.0 —
Moderate.................................................... — — 1,906.7 —
Moderately High ........................................ — — — —
High ............................................................ — — — —
Very High ................................................... — — — —
Total ........................................................... 945,518.0 135.0 775,305.1 230.0
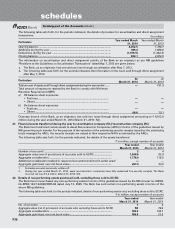
28. Details of Single Borrower Limit and Borrower Group Limit exceeded by the Bank
During the year ended March 31, 2014 and March 31, 2013, the Bank has complied with the Reserve Bank of India
guidelines on single borrower and borrower group limit.
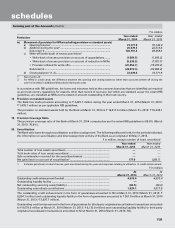
29. Unsecured advances against intangible assets
The Bank has not made advances against intangible collaterals of the borrowers, which are classified as ‘unsecured’ in
its financial statements at March 31, 2014 (March 31, 2013:Nil) and the estimated value of the intangible collaterals was
Nil at March 31, 2014 (March 31, 2013: Nil).
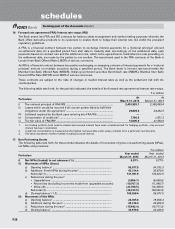
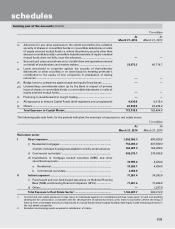
30. Fixed Assets
The following table sets forth, for the periods indicated, the movement in software acquired by the Bank, as included in
fixed assets.
` in million
Particulars At
March 31, 2014
At
March 31, 2013
At cost at March 31st of preceding year .............................................................. 8,508.0 7,055.2
Additions during the year ..................................................................................... 925.7 1,462.3
Deductions during the year .................................................................................. —(9.5)
Depreciation to date .............................................................................................. (7,298.8) (6,379.5)
Net block ................................................................................................................ 2,134.9 2,128.5
forming part of the Accounts (Contd.)
schedules