ICICI Bank 2003 Annual Report Download - page 88
Download and view the complete annual report
Please find page 88 of the 2003 ICICI Bank annual report below. You can navigate through the pages in the report by either clicking on the pages listed below, or by using the keyword search tool below to find specific information within the annual report.-
 1
1 -
2
-
3
-
4
-
5
-
6
-
7
-
8
-
9
-
10
-
11
-
12
-
13
-
14
-
15
-
16
-
17
-
18
-
19
-
20
-
21
-
22
-
23
-
24
-
25
-
26
-
27
-
28
-
29
-
30
-
31
-
32
-
33
-
34
-
35
-
36
-
37
-
38
-
39
-
40
-
41
-
42
-
43
-
44
-
45
-
46
-
47
-
48
-
49
-
50
-
51
-
52
-
53
-
54
-
55
-
56
-
57
-
58
-
59
-
60
-
61
-
62
-
63
-
64
-
65
-
66
-
67
-
68
-
69
-
70
-
71
-
72
-
73
-
74
-
75
-
76
-
77
-
 78
78 -
 79
79 -
 80
80 -
 81
81 -
 82
82 -
 83
83 -
 84
84 -
 85
85 -
 86
86 -
 87
87 -
 88
88 -
 89
89 -
 90
90 -
 91
91 -
 92
92 -
 93
93 -
 94
94 -
 95
95 -
 96
96 -
 97
97 -
 98
98 -
99
-
100
-
101
-
102
-
103
-
104
-
105
-
106
-
107
-
108
-
109
-
110
-
111
-
112
-
113
-
114
-
115
-
116
-
117
-
118
-
119
-
120
-
121
-
122
-
123
-
124
-
125
-
126
-
127
-
128
-
129
-
130
-
131
-
132
-
133
-
134
-
135
-
136
-
137
-
138
-
139
-
140
-
141
-
142
-
143
-
144
-
145
-
146
-
147
-
148
-
149
-
150
-
151
-
152
-
153
-
154
-
155
-
156
-
157
-
158
-
159
-
160
-
161
-
162
-
163
-
164
 |
 |
F24
forming part of the Accounts Continued
schedules
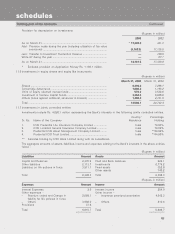
11.8 Risk category-wise country-wise exposure
The country exposure of the Bank is categorised into seven risk categories listed in the following table. Since the
country exposure (net) of the Bank does not exceed 2% of the total funded assets, no provision is required to be
maintained for country exposures.
(Rupees in million)
Risk Category Exposure (net) as
on March 31, 2003
Insignificant ............................................................................................... 3,559.5
Low ........................................................................................................... 205.9
Moderate ................................................................................................... 13.5
High ........................................................................................................... 12.5
Total ........................................................................................................... 3,791.4
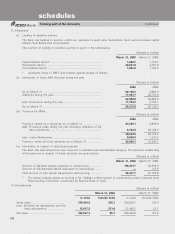
11.9 Interest Rate Swaps
(Rupees in million)
Notional Principal Hedging .................................................... 29,730.0
Trading ...................................................... 348,337.8
Fair Value Trading ...................................................... 308.8
Associated Credit Risk Trading ...................................................... 422.8
Market Risk (Trading Swaps) In the event of 100 basis points rise in the interest rates, there will be a negative impact
of Rs. 38.1 million on the swap book.
Collateral As per prevailing market practice, collateral is not insisted upon from counter party.
Credit risk concentration Standard Chartered Grindlays Bank Rs. 246.7 million.
(Trading Swaps)
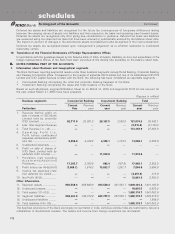
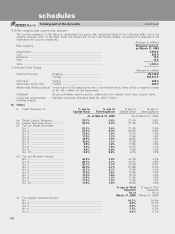
12. Others
a. Credit Exposure to % age to % age to % age to % age to
Capital funds Total Exposure Capital funds Total Exposure
As at March 31, 2003 As at March 31, 2002
(a) Single Largest Borrower ................ 22.3% 2.4% 21.4% 2.4%
(b) Largest Borrower Group ................ 44.2% 4.8% 41.3% 4.5%
(c) Top ten Single Borrowers
No. 1 ............................................... 22.3% 2.4% 21.4% 2.4%
No. 2 ............................................... 21.1% 2.3% 20.2% 2.2%
No. 3 ............................................... 13.8% 1.5% 14.1% 1.5%
No. 4 ............................................... 11.8% 1.3% 13.4% 1.5%
No. 5 ............................................... 10.9% 1.2% 12.6% 1.4%
No. 6 ............................................... 10.0% 1.1% 12.2% 1.3%
No. 7 ............................................... 8.9% 1.0% 11.0% 1.2%
No. 8 ............................................... 8.9% 1.0% 10.1% 1.1%
No. 9 ............................................... 8.6% 0.9% 9.4% 1.0%
No. 10 ............................................. 8.2% 0.9% 9.3% 1.0%
(d) Top ten Borrower Groups
No. 1 ............................................... 44.2% 4.8% 41.3% 4.5%
No. 2 ............................................... 28.1% 3.1% 32.7% 3.6%
No. 3 ............................................... 28.1% 3.1% 23.5% 2.6%
No. 4 ............................................... 25.2% 2.7% 21.0% 2.3%
No. 5 ............................................... 19.1% 2.1% 19.2% 2.1%
No. 6 ............................................... 18.5% 2.0% 13.4% 1.5%
No. 7 ............................................... 14.3% 1.6% 12.1% 1.3%
No. 8 ............................................... 11.8% 1.3% 11.9% 1.3%
No. 9 ............................................... 11.4% 1.2% 11.8% 1.3%
No. 10 ............................................. 11.0% 1.2% 10.8% 1.2%
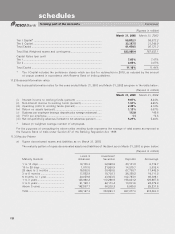
% age to Total % age to Total
Exposure Exposure
As at As at
March 31, 2003 March 31, 2002
(e) Five largest Industrial Sectors
No. 1 .................................................................................................. 10.1% 10.9%
No. 2 .................................................................................................. 9.6% 10.7%
No. 3 .................................................................................................. 8.5% 9.1%
No. 4 .................................................................................................. 5.2% 6.2%
No. 5 .................................................................................................. 4.9% 5.1%