ICICI Bank 2003 Annual Report Download - page 56
Download and view the complete annual report
Please find page 56 of the 2003 ICICI Bank annual report below. You can navigate through the pages in the report by either clicking on the pages listed below, or by using the keyword search tool below to find specific information within the annual report.-
 1
1 -
2
-
3
-
4
-
5
-
6
-
7
-
8
-
9
-
10
-
11
-
12
-
13
-
14
-
15
-
16
-
17
-
18
-
19
-
20
-
21
-
22
-
23
-
24
-
25
-
26
-
27
-
28
-
29
-
30
-
31
-
32
-
33
-
34
-
35
-
36
-
37
-
38
-
39
-
40
-
41
-
42
-
43
-
44
-
45
-
 46
46 -
 47
47 -
 48
48 -
 49
49 -
 50
50 -
 51
51 -
 52
52 -
 53
53 -
 54
54 -
 55
55 -
 56
56 -
 57
57 -
 58
58 -
 59
59 -
 60
60 -
 61
61 -
 62
62 -
 63
63 -
 64
64 -
 65
65 -
 66
66 -
67
-
68
-
69
-
70
-
71
-
72
-
73
-
74
-
75
-
76
-
77
-
78
-
79
-
80
-
81
-
82
-
83
-
84
-
85
-
86
-
87
-
88
-
89
-
90
-
91
-
92
-
93
-
94
-
95
-
96
-
97
-
98
-
99
-
100
-
101
-
102
-
103
-
104
-
105
-
106
-
107
-
108
-
109
-
110
-
111
-
112
-
113
-
114
-
115
-
116
-
117
-
118
-
119
-
120
-
121
-
122
-
123
-
124
-
125
-
126
-
127
-
128
-
129
-
130
-
131
-
132
-
133
-
134
-
135
-
136
-
137
-
138
-
139
-
140
-
141
-
142
-
143
-
144
-
145
-
146
-
147
-
148
-
149
-
150
-
151
-
152
-
153
-
154
-
155
-
156
-
157
-
158
-
159
-
160
-
161
-
162
-
163
-
164
 |
 |

Management’s Discussion & Analysis
54
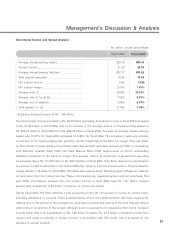
Aggregate interest expense increased to Rs. 79.44 billion in fiscal 2003 from Rs. 15.59 billion in fiscal 2002,
due to increase in average interest bearing liabilities to Rs. 891.62 billion for fiscal 2003 from Rs. 207.37 billion
for fiscal 2002 and increase in total cost of funds to 8.91% in fiscal 2003 from 7.52% in fiscal 2002. The
increase in cost of funds was primarily due to the impact of the higher-cost borrowings of ICICI transferred
to the Bank on merger. This was partially offset by the repayment of Rs. 224.00 billion of ICICI’s liabilities and
reduction in the cost of deposits. The average cost of deposits declined to 6.77% for fiscal 2003 from
7.28% for fiscal 2002.
ICICI Bank’s net interest margin and yield spread were adversely impacted by the large investments made in
Government securities and cash balances with RBI in the latter half of fiscal 2002 to comply with SLR and CRR
requirements on ICICI’s outstanding higher-cost liabilities transferred to the Bank on merger. The yield spread
decreased by 86 basis points to 1.30% in fiscal 2003 from 2.16% in fiscal 2002.
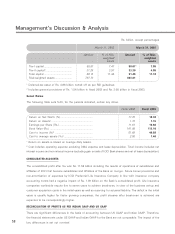
Non-Interest Income
Non-interest income increased to Rs. 19.67 billion in fiscal 2003 as compared to Rs. 5.75 billion in fiscal 2002.
The components of non-interest income are discussed below:
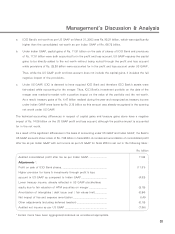
Fee Income
Fee income increased to Rs. 8.47 billion in fiscal 2003 as compared to Rs. 2.72 billion in fiscal 2002. Retail
banking fee income increased to Rs. 3.21 billion in fiscal 2003 as compared to Rs. 1.07 billion in fiscal 2002,
primarily due to the growth in loan-processing fees, income from credit cards and other retail banking services.
The number of credit cards increased to about 1 million at March 31, 2003 from about 0.6 million at March
31, 2002. Corporate banking fee income increased to Rs. 5.26 billion in fiscal 2003 from Rs. 1.65 billion in fiscal
2002, driven primarily by increase in transaction banking and other fees.
Treasury Income
The total income from treasury-related activities increased to Rs. 4.47 billion in fiscal 2003 from Rs. 2.92 billion
in fiscal 2002, due to the increase in trading profits on Government securities and corporate debt trading as
a result of the declining interest rate environment. Profit from foreign exchange transactions is net of forward
premium expenses of Rs. 0.64 billion on foreign currency liabilities.
Lease Income
Leased assets of Rs. 22.27 billion were transferred to the Bank from ICICI on merger. Leased assets of
Rs. 17.70 billion were outstanding at March 31, 2003. Gross lease income for fiscal 2003 was Rs. 5.37 billion
and the related lease depreciation was Rs. 3.14 billion.
Others
Other non-interest income in fiscal 2003 includes dividend income received from subsidiaries of
Rs. 1.09 billion.