ICICI Bank 2003 Annual Report Download - page 155
Download and view the complete annual report
Please find page 155 of the 2003 ICICI Bank annual report below. You can navigate through the pages in the report by either clicking on the pages listed below, or by using the keyword search tool below to find specific information within the annual report.-
 1
1 -
2
-
3
-
4
-
5
-
6
-
7
-
8
-
9
-
10
-
11
-
12
-
13
-
14
-
15
-
16
-
17
-
18
-
19
-
20
-
21
-
22
-
23
-
24
-
25
-
26
-
27
-
28
-
29
-
30
-
31
-
32
-
33
-
34
-
35
-
36
-
37
-
38
-
39
-
40
-
41
-
42
-
43
-
44
-
45
-
46
-
47
-
48
-
49
-
50
-
51
-
52
-
53
-
54
-
55
-
56
-
57
-
58
-
59
-
60
-
61
-
62
-
63
-
64
-
65
-
66
-
67
-
68
-
69
-
70
-
71
-
72
-
73
-
74
-
75
-
76
-
77
-
78
-
79
-
80
-
81
-
82
-
83
-
84
-
85
-
86
-
87
-
88
-
89
-
90
-
91
-
92
-
93
-
94
-
95
-
96
-
97
-
98
-
99
-
100
-
101
-
102
-
103
-
104
-
105
-
106
-
107
-
108
-
109
-
110
-
111
-
112
-
113
-
114
-
115
-
116
-
117
-
118
-
119
-
120
-
121
-
122
-
123
-
124
-
125
-
126
-
127
-
128
-
129
-
130
-
131
-
132
-
133
-
134
-
135
-
136
-
137
-
138
-
139
-
140
-
141
-
142
-
143
-
144
-
 145
145 -
 146
146 -
 147
147 -
 148
148 -
 149
149 -
 150
150 -
 151
151 -
 152
152 -
 153
153 -
 154
154 -
 155
155 -
 156
156 -
 157
157 -
 158
158 -
 159
159 -
 160
160 -
 161
161 -
 162
162 -
 163
163 -
 164
164
 |
 |

F91
The Company has not recorded any compensation cost, as the exercise price was equal to the fair value of the
underlying equity shares on the grant date. As shares of ICICI OneSource Limited are not quoted on exchanges, the
fair value represents management’s best estimates considering all available factors.
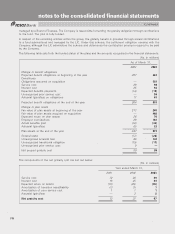
28. Income taxes
Components of deferred tax balances
The tax effects of temporary differences are reflected through a deferred taxasset/liability, which is included in the
balance sheet of the Company.
The components of the deferred tax balances are set out below:
(Rs. in millions)
As of March 31,
2002 2003
Deferred tax assets
Allowance for loan losses 12,263 16,228
Available for sale securities 2,141 1,044
Investments in trading securities 176 62
Unearned income 1,264 693
Capital loss carry forward 31 23
Business loss carry forward 175 219
Deposits —94
Other 676 574
16,726 18,937
Valuation allowance (226) (524)
Total deferred tax asset 16,500 18,413
Deferred tax liabilities
Property and equipment (9,416) (9,216)
Undistributed earnings of subsidiary and affiliates (875) (294)
Intangibles —(1,857)
Investment in trading securities —(39)
Long term debt —(666)
Available for sale securities —(20)
Others (58) (358)
Total deferred tax liability (10,349) (12,450)
Net deferred tax asset 6,151 5,963
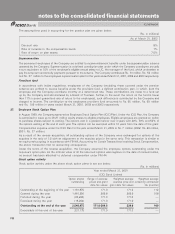
In assessing the realizability of deferred tax assets, management considers whether it is more likely than not that some
portion or all of the deferred tax assets will not be realized. The ultimate realization of the deferred tax asset is
dependent on the generation of future taxable income during the periods in which the temporary differences become
deductible. Management considers the scheduled reversal of the projected future taxable income, and tax planning
strategies in making this assessment. Based on the level of historical taxable income and projections for future taxable
incomes over the periods in which the deferred tax assets are deductible, management believes that it is more likely
than not that the Company will realize the benefits of those deductible differences. The amount of deferred tax assets
considered realizable, however could be reduced in the near term if estimates of future taxable income are reduced.
The Company would require taxable income of Rs. 21,266 million in the future periods to be able to fully realize the
benefit of net deferred asset recognized in these consolidated financial statements.
Continued
notes to the consolidated financial statements