ICICI Bank 2003 Annual Report Download - page 83
Download and view the complete annual report
Please find page 83 of the 2003 ICICI Bank annual report below. You can navigate through the pages in the report by either clicking on the pages listed below, or by using the keyword search tool below to find specific information within the annual report.-
 1
1 -
2
-
3
-
4
-
5
-
6
-
7
-
8
-
9
-
10
-
11
-
12
-
13
-
14
-
15
-
16
-
17
-
18
-
19
-
20
-
21
-
22
-
23
-
24
-
25
-
26
-
27
-
28
-
29
-
30
-
31
-
32
-
33
-
34
-
35
-
36
-
37
-
38
-
39
-
40
-
41
-
42
-
43
-
44
-
45
-
46
-
47
-
48
-
49
-
50
-
51
-
52
-
53
-
54
-
55
-
56
-
57
-
58
-
59
-
60
-
61
-
62
-
63
-
64
-
65
-
66
-
67
-
68
-
69
-
70
-
71
-
72
-
 73
73 -
 74
74 -
 75
75 -
 76
76 -
 77
77 -
 78
78 -
 79
79 -
 80
80 -
 81
81 -
 82
82 -
 83
83 -
 84
84 -
 85
85 -
 86
86 -
 87
87 -
 88
88 -
 89
89 -
 90
90 -
 91
91 -
 92
92 -
 93
93 -
94
-
95
-
96
-
97
-
98
-
99
-
100
-
101
-
102
-
103
-
104
-
105
-
106
-
107
-
108
-
109
-
110
-
111
-
112
-
113
-
114
-
115
-
116
-
117
-
118
-
119
-
120
-
121
-
122
-
123
-
124
-
125
-
126
-
127
-
128
-
129
-
130
-
131
-
132
-
133
-
134
-
135
-
136
-
137
-
138
-
139
-
140
-
141
-
142
-
143
-
144
-
145
-
146
-
147
-
148
-
149
-
150
-
151
-
152
-
153
-
154
-
155
-
156
-
157
-
158
-
159
-
160
-
161
-
162
-
163
-
164
 |
 |

F19
forming part of the Accounts Continued
schedules
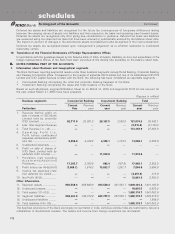
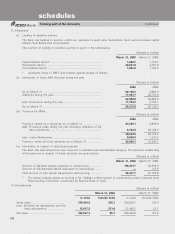
The computation of Earnings Per Share is set out below :
Rupees in million except per share data
March 31, 2003 March 31, 2002
Basic
Weighted Average no. of equity shares
Outstanding (Nos.) .................................................................................... 613,031,569 *222,510,311
Net Profit ................................................................................................... 12,061.8 2,583.0
Earnings per Share (Rs.) ........................................................................... 19.68 11.61
Diluted
Weighted Average no. of equity shares
Outstanding (Nos.) .................................................................................... 613,750,295 *222,510,311
Net Profit ................................................................................................... 12,061.8 2,583.0
Earnings per Share (Rs.) ........................................................................... 19.65 11.61
Nominal Value per share (Rs.) ................................................................. 10.00 10.00
* 39,26,72,724 shares issued on amalgamation of ICICI Limited have been considered for computation of weighted
average number of equity shares.
The dilutive impact is mainly due to options issued to employees by the Bank
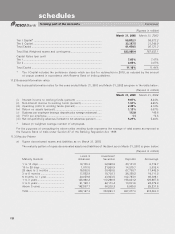
10. Assets under lease
10.1 Assets under operating lease
The future lease rentals are given in the table below :
(Rupees in million)
Period March 31, 2003
Not later than one year ............................................................................ 108.5
Later than one year and not later than five years ................................. 537.9
Later than five years ................................................................................. 472.0
Total ........................................................................................................... 1,118.4
10.2 Assets under finance lease
The future lease rentals are given in the table below :
(Rupees in million)
Period March 31, 2003
Total of future minimum lease payments ............................................... 1,161.0
Present value of lease payments............................................................. 818.1
Unmatured finance charges ..................................................................... 342.9
Maturity profile of total of future minimum lease payments
Not later than one year .................................................................... 166.0
Later than one year and not later than five years ......................... 831.9
Later than five years ......................................................................... 163.1
Total ........................................................................................................... 1,161.0
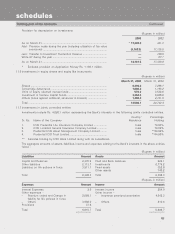
11. Additional Disclosures
The following additional disclosures have been made taking into account RBI guidelines in this regard.
11.1 Capital Adequacy Ratio
The Capital to Weighted Risk Assets Ratio (CRAR) as assessed by the Bank on the basis of the attached financial
statements and guidelines issued by RBI is given in the table below :