ICICI Bank 2003 Annual Report Download - page 117
Download and view the complete annual report
Please find page 117 of the 2003 ICICI Bank annual report below. You can navigate through the pages in the report by either clicking on the pages listed below, or by using the keyword search tool below to find specific information within the annual report.-
 1
1 -
2
-
3
-
4
-
5
-
6
-
7
-
8
-
9
-
10
-
11
-
12
-
13
-
14
-
15
-
16
-
17
-
18
-
19
-
20
-
21
-
22
-
23
-
24
-
25
-
26
-
27
-
28
-
29
-
30
-
31
-
32
-
33
-
34
-
35
-
36
-
37
-
38
-
39
-
40
-
41
-
42
-
43
-
44
-
45
-
46
-
47
-
48
-
49
-
50
-
51
-
52
-
53
-
54
-
55
-
56
-
57
-
58
-
59
-
60
-
61
-
62
-
63
-
64
-
65
-
66
-
67
-
68
-
69
-
70
-
71
-
72
-
73
-
74
-
75
-
76
-
77
-
78
-
79
-
80
-
81
-
82
-
83
-
84
-
85
-
86
-
87
-
88
-
89
-
90
-
91
-
92
-
93
-
94
-
95
-
96
-
97
-
98
-
99
-
100
-
101
-
102
-
103
-
104
-
105
-
106
-
 107
107 -
 108
108 -
 109
109 -
 110
110 -
 111
111 -
 112
112 -
 113
113 -
 114
114 -
 115
115 -
 116
116 -
 117
117 -
 118
118 -
 119
119 -
 120
120 -
 121
121 -
 122
122 -
 123
123 -
 124
124 -
 125
125 -
 126
126 -
 127
127 -
128
-
129
-
130
-
131
-
132
-
133
-
134
-
135
-
136
-
137
-
138
-
139
-
140
-
141
-
142
-
143
-
144
-
145
-
146
-
147
-
148
-
149
-
150
-
151
-
152
-
153
-
154
-
155
-
156
-
157
-
158
-
159
-
160
-
161
-
162
-
163
-
164
 |
 |

F53
at March 31,
2002
(1)
2003 2003
Convenience
translation
into USD
(unaudited)
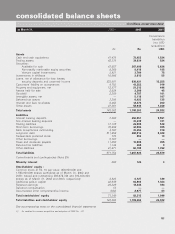
Rs. Rs. USD
Assets
Cash and cash equivalents 41,476 72,453 1,524
Trading assets 42,376 39,634 834
Securities:
Available for sale 47,857 267,499 5,626
Non-readily marketable equity securities 8,268 9,418 198
Venture capital investments 3,921 3,704 78
Investments in affiliates 10,086 2,615 55
Loans, net of allowance for loan losses,
security deposits and unearned income 523,601 630,421 13,258
Customers’ liability on acceptances 4,783 43,252 910
Property and equipment, net 12,577 21,215 446
Assets held for sale 2,029 2,306 48
Goodwill 2,250 4,787 101
Intangible assets, net —5,118 107
Deferred tax assets 7,295 6,423 135
Interest and fees receivable 9,482 12,472 262
Other assets 27,361 58,946 1,240
Total assets 743,362 1,180,263 24,822
Liabilities
Interest bearing deposits 7,380 456,051 9,591
Non-interest bearing deposits —35,239 741
Trading liabilities 17,105 26,086 549
Short-term borrowings 70,804 42,095 885
Bank acceptances outstanding 4,783 43,252 910
Long-term debt 511,458 400,812 8,429
Redeemable preferred stock 772 853 18
Other borrowings 5,787 ——
Taxes and dividends payable 11,050 16,880 355
Deferred tax liabilities 1,144 460 9
Other liabilities 41,471 66,198 1,392
Total liabilities 671,754 1,087,926 22,879
Commitments and contingencies (Note 29)
Minority interest 260 124 3
Stockholders’ equity :
Common stock at Rs. 10 par value: 800,000,000 and
1,550,000,000 shares authorized as of March31, 2002 and
2003; Issued and outstanding 392,672,724 and 613,034,404
shares as of March31, 2002 and 2003, respectively 3,922 6,127 129
Additional paid-in capital 42,036 64,863 1,364
Retained earnings 26,229 18,246 384
Deferred compensation (7) ——
Accumulated other comprehensive income (832) 2,977 63
Total stockholders’ equity 71,348 92,213 1,940
Total liabilities and stockholders’ equity 743,362 1,180,263 24,822
See accompanying notes to the consolidated financial statements.
(1) As restated for reverse acquisition and adoption of SFAS No. 147
(in millions, except share data)
consolidated balance sheets